
 | |
Software (HISTAN, PDBAN,
GELAN) | Custom
syntax files | Files for
GETAREA | Scripts for VMD | Scripts
for NAMD | Structures | Other
Please address comments or questions to Andriy
Anishkin (anishkin@icqmail.com).
General note: Some of these programs and scripts are
documented in a minimalistic fashion since they were originally developed with
an "indoor" use in mind. Nevertheless we decided to make them
available to scientific community since they may be of use or interest to
researchers working on similar problems. Better documented versions are on their
way. We will be happy to help with their installation and usage as much as we
can, but potential users should realize that certain difficulties and risks
might be associated with using the programs which are in the process of
development.
Software written in Matlab
 |
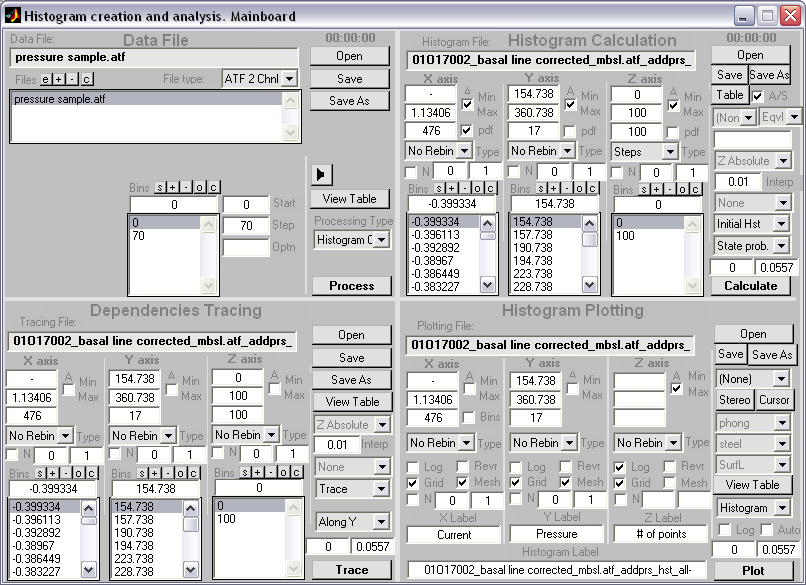
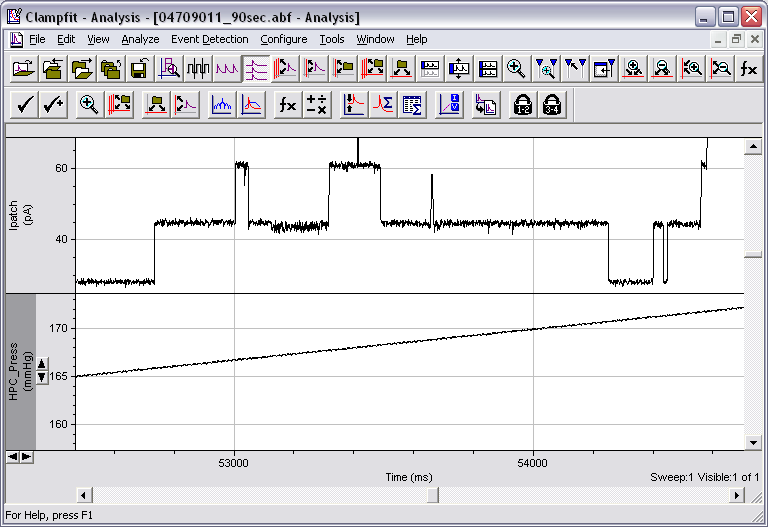
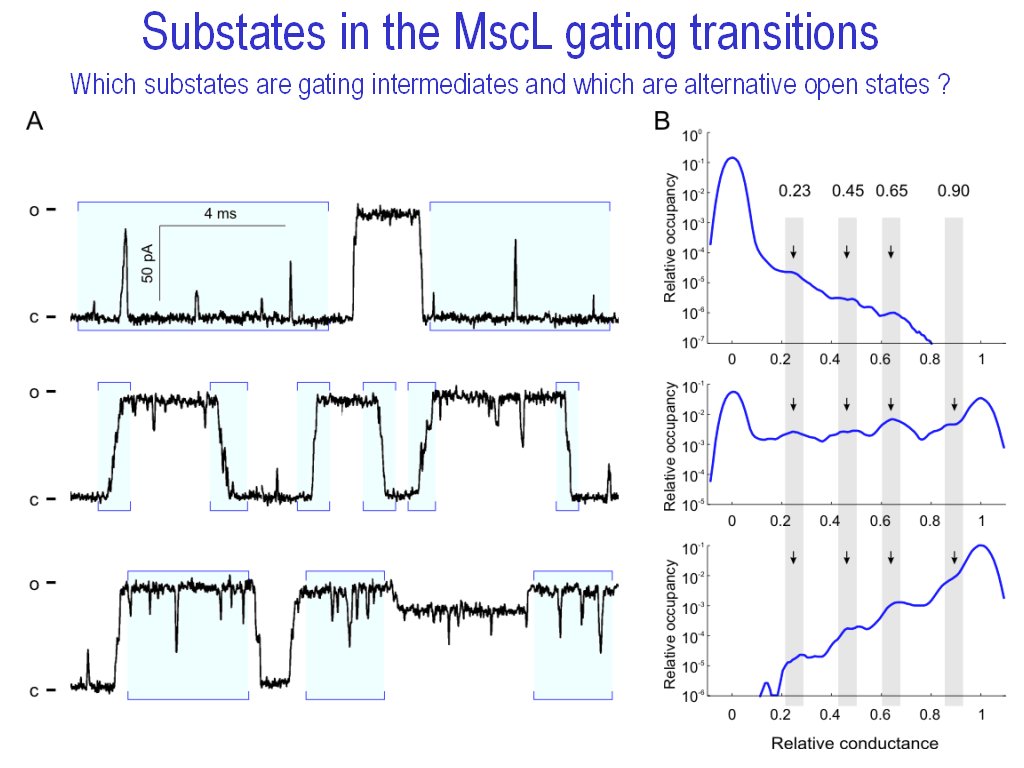
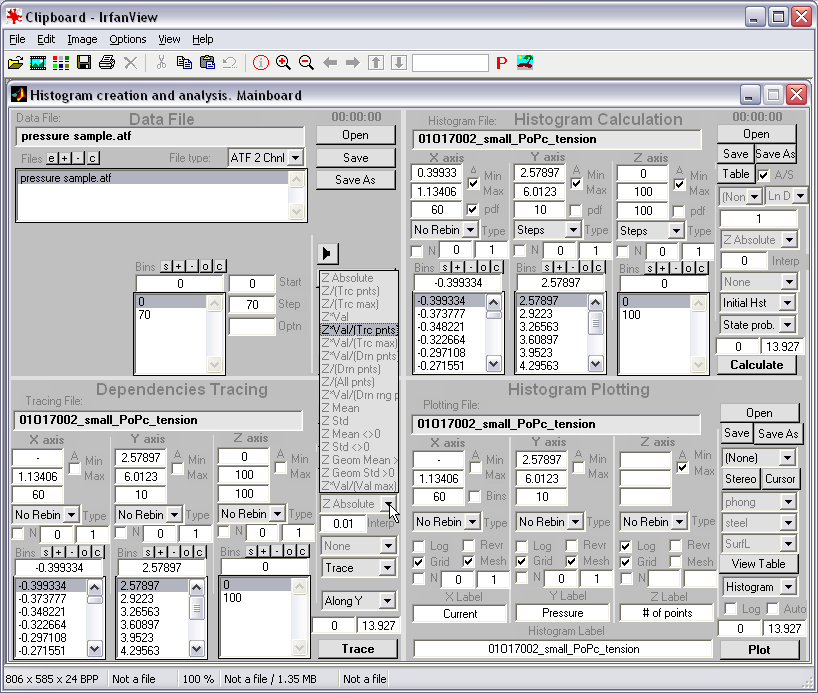
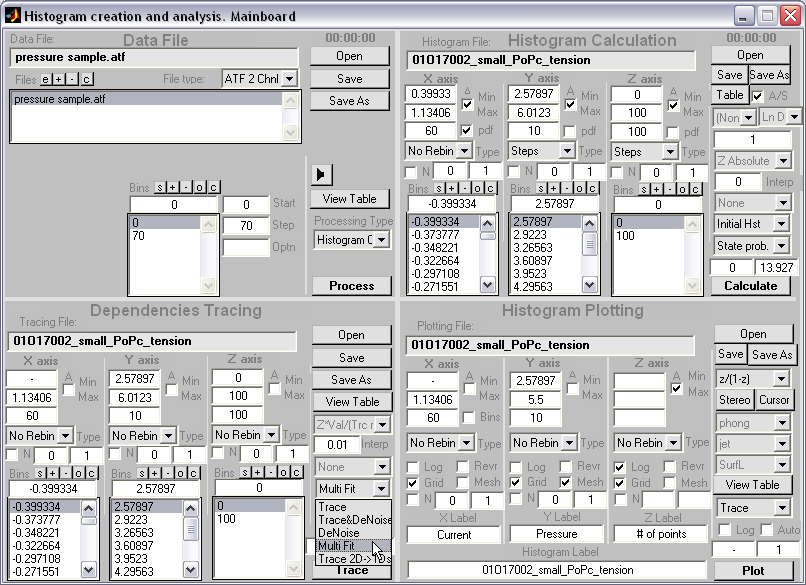
HISTAN - program package for histogram-based analysis of patch-clamp
recordings (|||image).
It was used for 3D histogram creation, activation curve computations, and
multi-distributional fitting in Anishkin
et al., 2003, Chiang
et al., 2004, Akitake
et al., 2005, and Anishkin
et al., 2005.
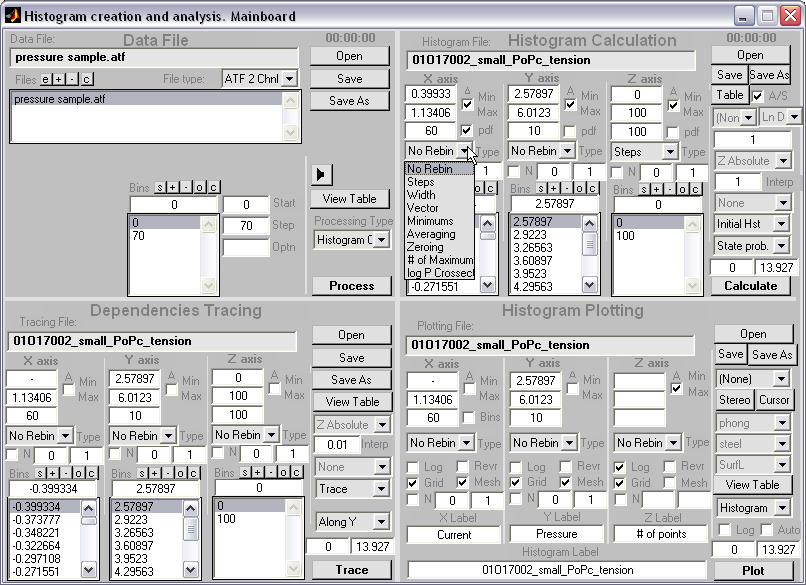
General program features:
 |
Batch processing of
patch-clamp recordings (|||image)
 |
Input and
output in the Axon ATF format (|||image).
Piecewise file processing - handles ~unlimitedly large files (~4 Gb).
Files can be zipped to reduce file disk size. |
|
Batch
processing of the list of files. |
|
Scaling of
the current or pressure amplitudes |
|
Fusion of
current and pressure recording channels into one trace |
|
Connection
of several traces into one long trace |
|
Reconstruction
of the pressure channel using external approximated data |
|
Removing a
piece from the middle of the trace |
|
Automated
correction of the baseline |
|
|
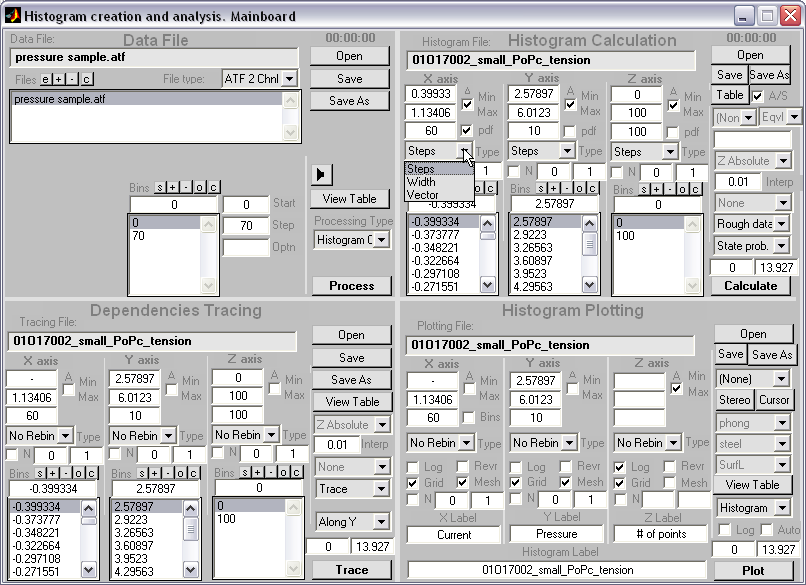
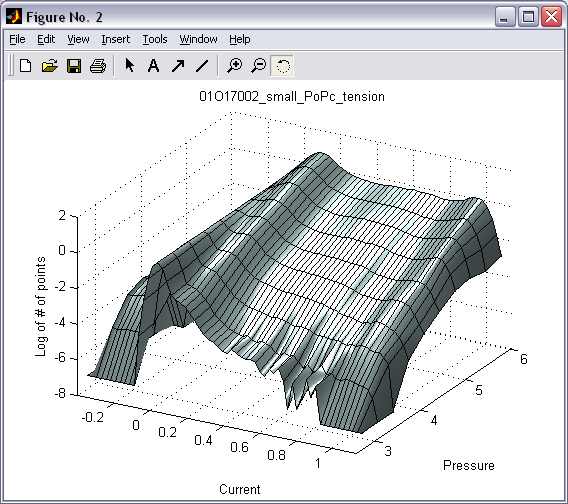
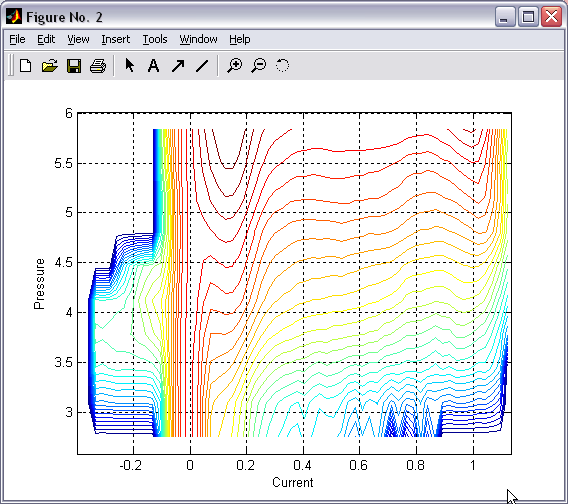
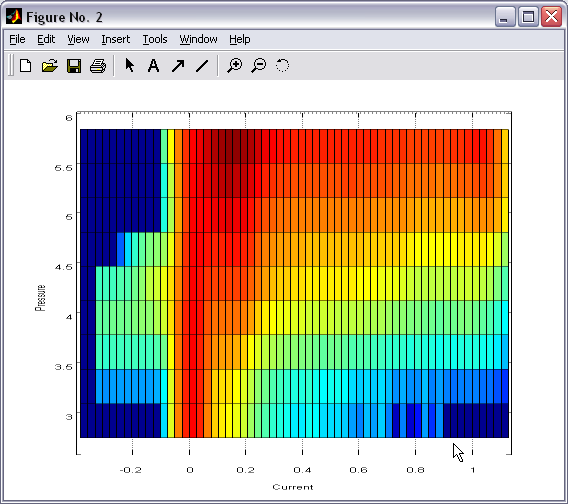
Batch creation of 2D
all-point histograms (|||image)
|
Probability
over current-pressure or current-time dimensions (|||image) |
|
Arbitrary
ranges of histograms. Arbitrary predefined number, width or explicit
boundaries of bins. |
|
Output
saved as a readable plain text file |
|
Both
discrete steps and continuous ramps of pressure can be
treated equally well. |
|
|
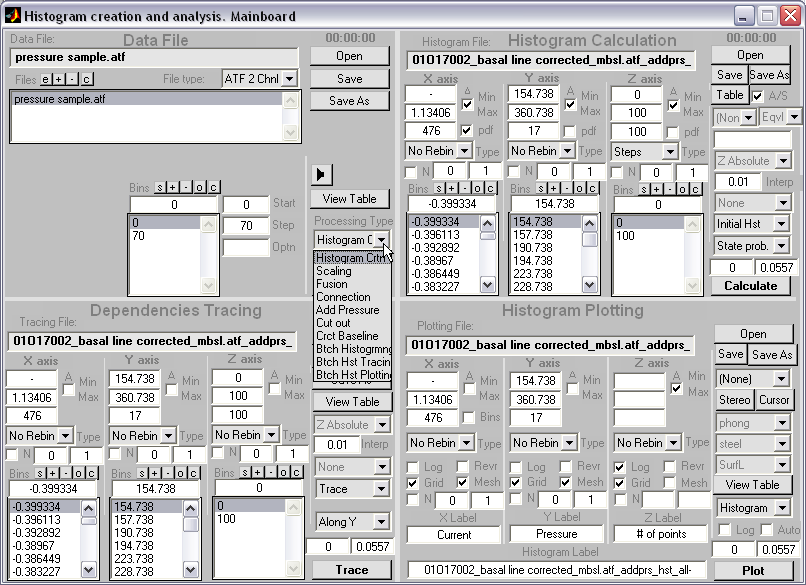
Conditional 2D histograms
creation (|||image)
|
Traces may
be automatically processed so that only selected fragments or points
will be counted. E.g. only channel transitions, pikes or substates
will be included (|||image) |
|
Flexible
set of conditions (23 condition types x 8 range types) allows to
describe practically any pattern of channel activity or specific
points of interest. Combination of 3 conditions can be used (|||image). |
|
The
selected points are marked in a control output ATF file, so all the
included fragments can be visually inspected in Clampfit. |
|
|
Batch processing of the
created 2D histograms (|||image)
|
2D
histograms crated in the previous steps can be reloaded for
additional processing |
|
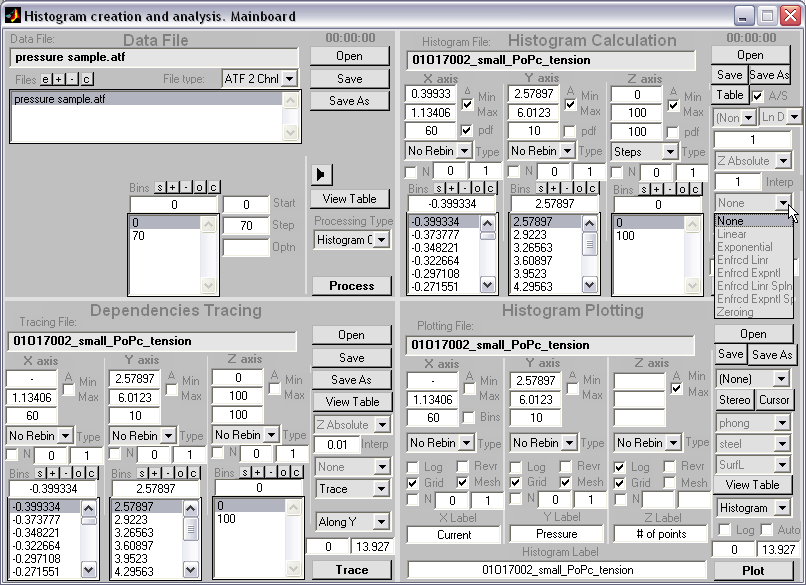
Rebinning
of the histograms into smaller or larger number of bins,
automatically calculated, defined by bin width, or explicitly
specified. |
|
Histograms
can be automatically rebinned according to pressure steps. by mi |
|
When
number of points increases after rebinning or in case of the missing
data points 2D histograms can be interpolated with 1 of 6
functions (|||image) |
|
Histograms
can be rebinned automatically according to steps in pressure in
order to maximize data reliability |
|
Data can
be properly normalized thus compensating for nonuniform pressure
steps or ramps |
|
Histograms
can be neighbor-averaged in either direction to reduce the noise and
compensate for bins undersampling (if necessary) |
|
Any range
of histogram can be zeroed. Any bins can be removed or added. |
|
Current
and pressure axis can be normalized, e.g. to produce relative
current from 0 to 1, or pressure normalization relative some
benchmark (like MscL relative to MscS channel) |
|
|
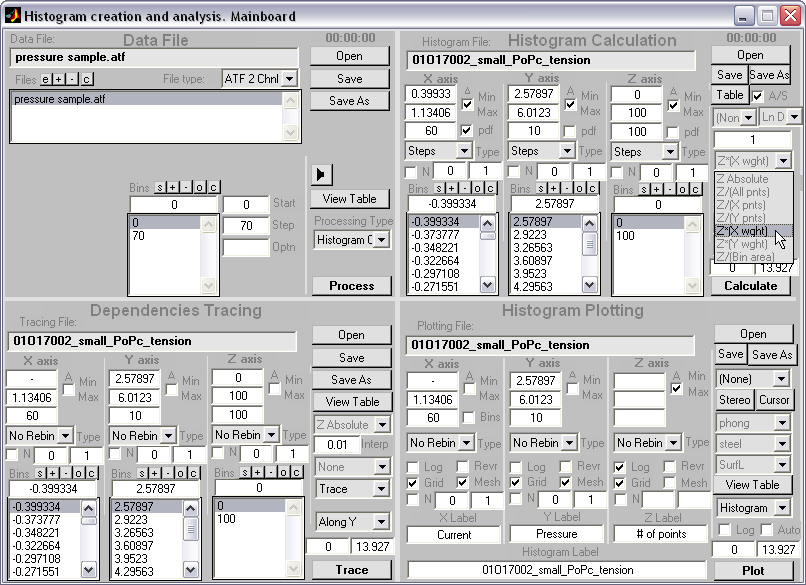
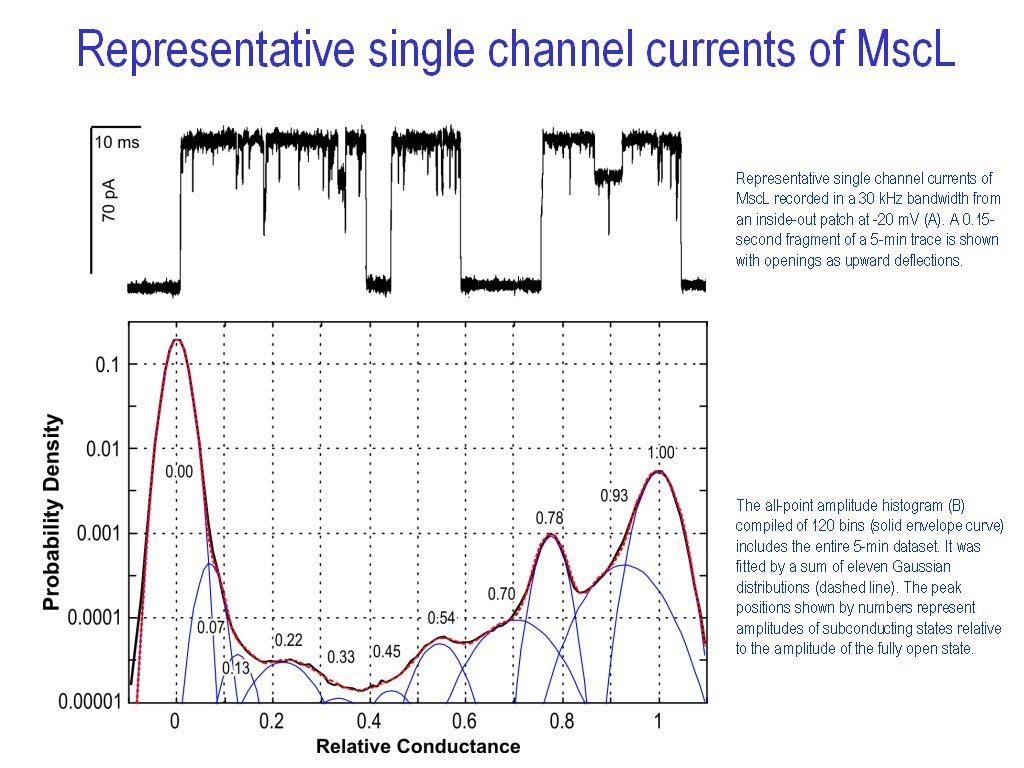
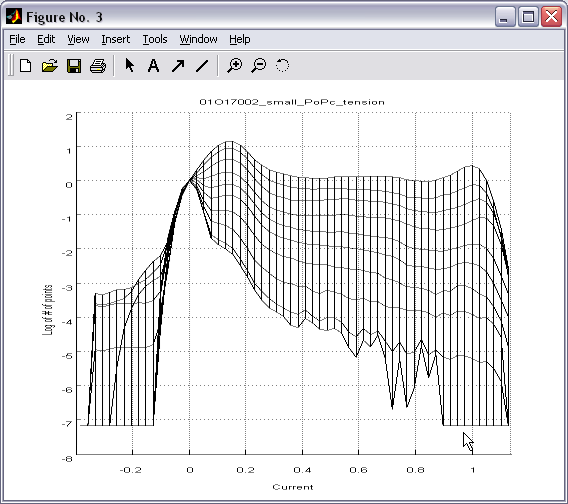
Batch creation and processing
of 1D histograms (|||image)
on the basis of 2D histograms (|||image,
image)
|
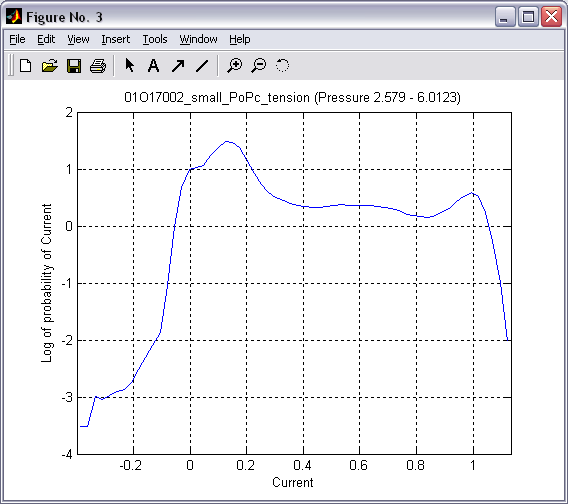
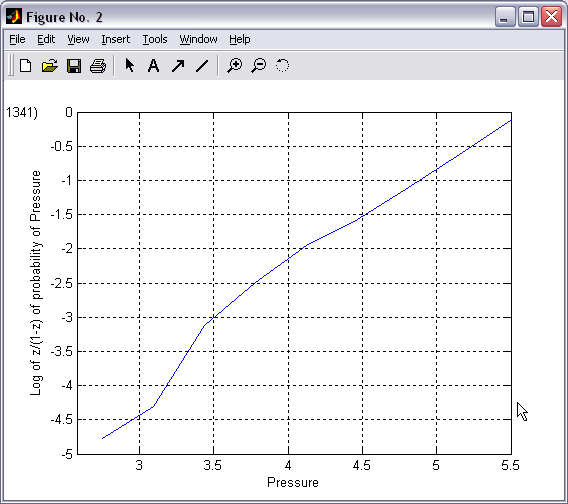
Selected
range of 2D histogram can be traced into one or several 1D
histograms. Tracing along the current axis produces conventional
all-point occupancy histogram (|||image),
whereas tracing along the pressure axis (with proper conversion and
weighting (|||image))
leads directly to dose-response and activation curves (|||image). |
|
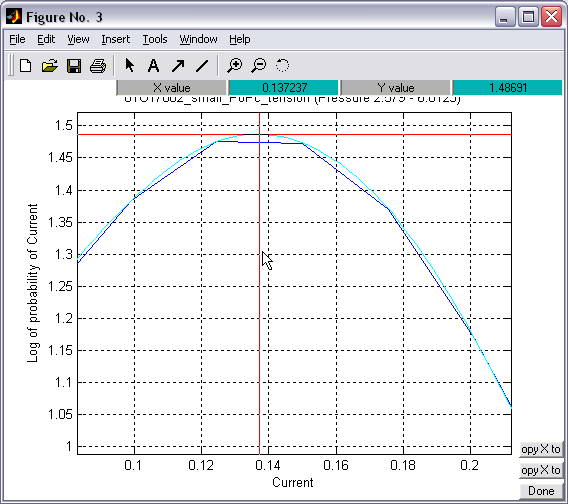
Values in
1D histograms can be interpolated and tracked with the cursor, so
that numeric values can be extracted (|||image) |
|
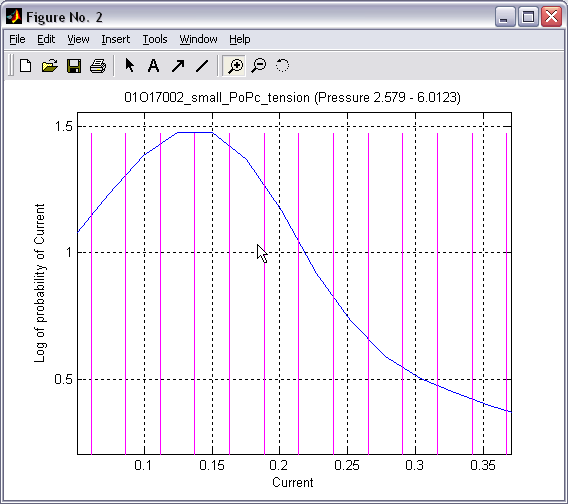
Explicit
histogram bins boundaries can be shown (|||image) |
|
1D
histograms can be saved in plain tab-separated text files importable
into Excel |
|
|
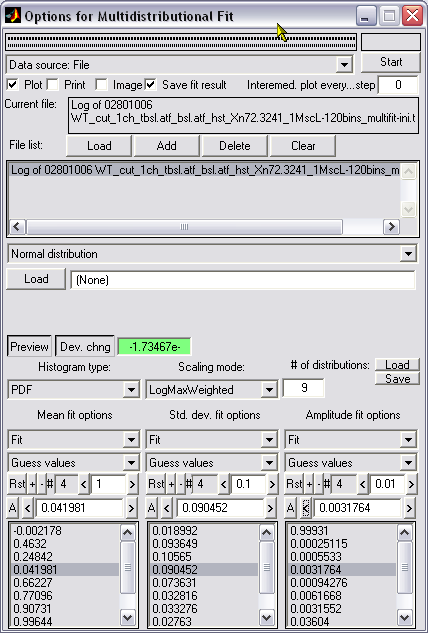
Automated or manual fitting
of 1D histograms with a set of normal distributions for substates
decomposition (|||image,
image)
|
1D
histogram from the file or from memory can be fitted with arbitrary
number of normal distributions (|||image) |
|
Position,
width and height (i.e. amplitude or substate occupancy) of normal
distributions are independent tuning parameters |
|
Fully
automated (global optimization of all the parameters for all the
selected distributions), semi-automated (automated optimization of
one parameter of one distribution), or manual modes are available |
|
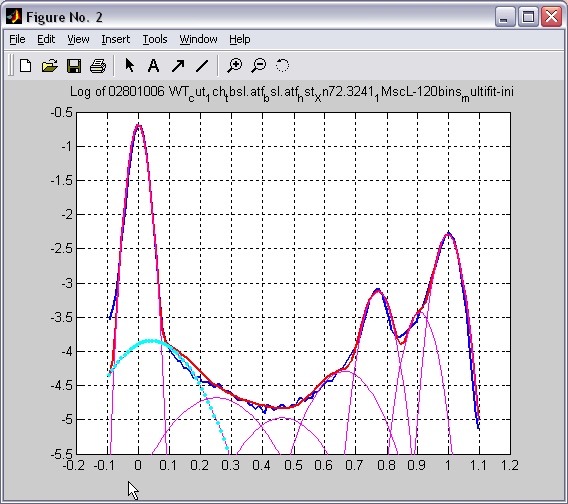
Dual
control of the fitting quality - visual (|||image)
and by the numeric estimation (|||image)
of fit-target deviation. Several weighting functions for deviation
estimation are available |
|
All the
results and tuned parameters are saved in text files and snapshots,
and can be loaded as a preset for the next histogram fitting |
|
|
Batch plotting of 2D and 1D
histograms (|||image,
image)
|
Either
individual or set of 2D or 1D histograms can be plotted directly
from the program. Zoom, cursor (|||image)
and 3D rotation features of Matlab are available. |
|
For 2D
histogram a wide range of representations and coloring is available
(|||image,
image,
image,
image) |
|
|
|
PDBAN - package for handling and analysis of PDB structures.
It was used in molecular structures and MD trajectories analysis, hydration energy
and crossectional area profiles calculations in Anishkin
and Sukharev, 2004, Chiang
et al., 2004, Sukharev
and Anishkin, 2005.
General program features:
|
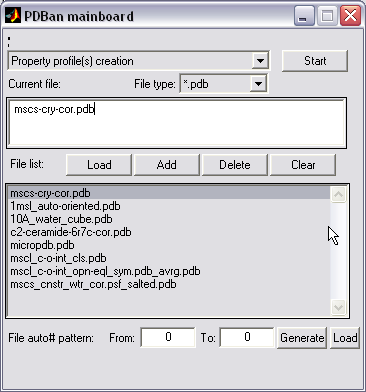
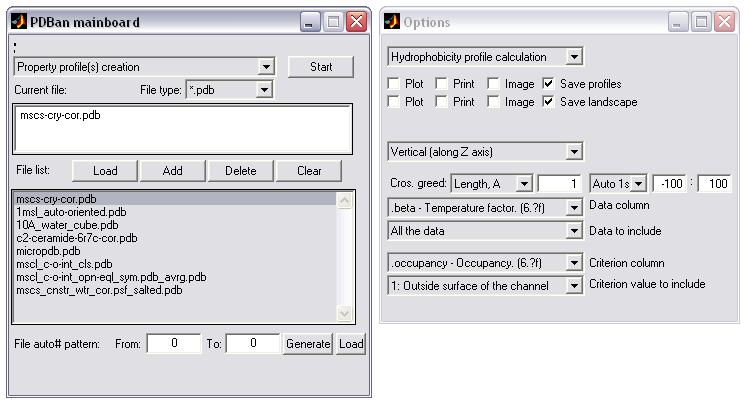
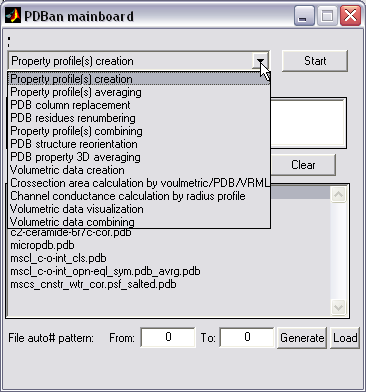
Batch processing of files (|||image)
|
Expandable two-window interface
(|||image).
PDB mainboard window is permanent and allows consistent file
browsing and processing mode selection (|||image).
Options window is different for every selected mode. |
|
List of PDB, volumetric
data or other files can be processed at once as a batch |
|
For regularly numbered files
(e.g. file000031.pdb ... file125672.pdb) the list can be generated
automatically (|||image).
Length of file list is unlimited, that allows to overcome Windows
limitation of using file dialog for browsing more than ~1000 files
at a time (you can have much more as PDBs of simulation time
frames). |
|
File list can be loaded from the
text file (for complex and long file selections) |
|
All data input files (PDB,
volumetric, VRML, txt) and most of output files can be in ZIP
format, allowing to reduce file size dramatically (5 to 200 times) |
|
|
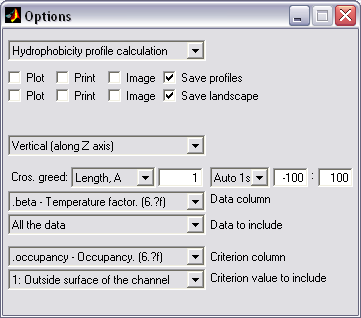
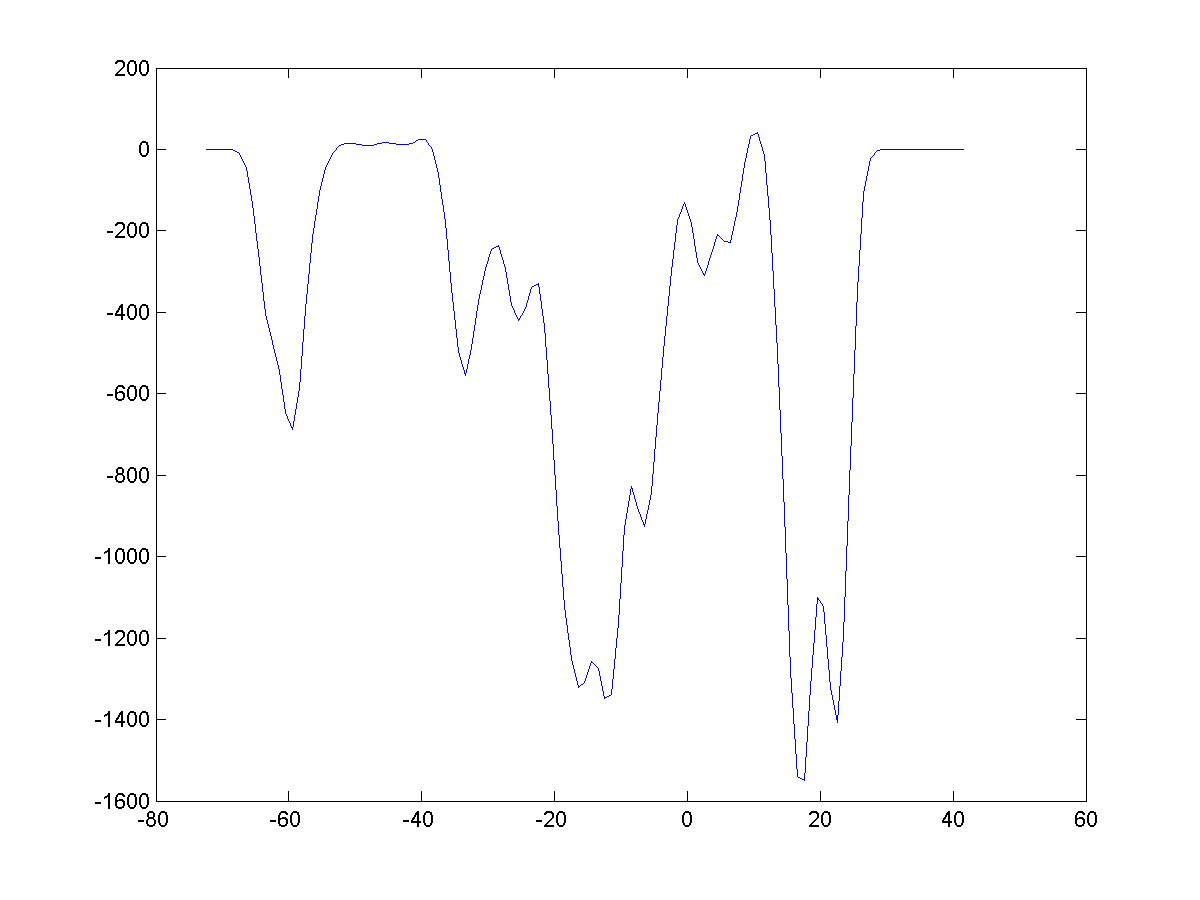
Property profiles creation (|||image,
image)
|
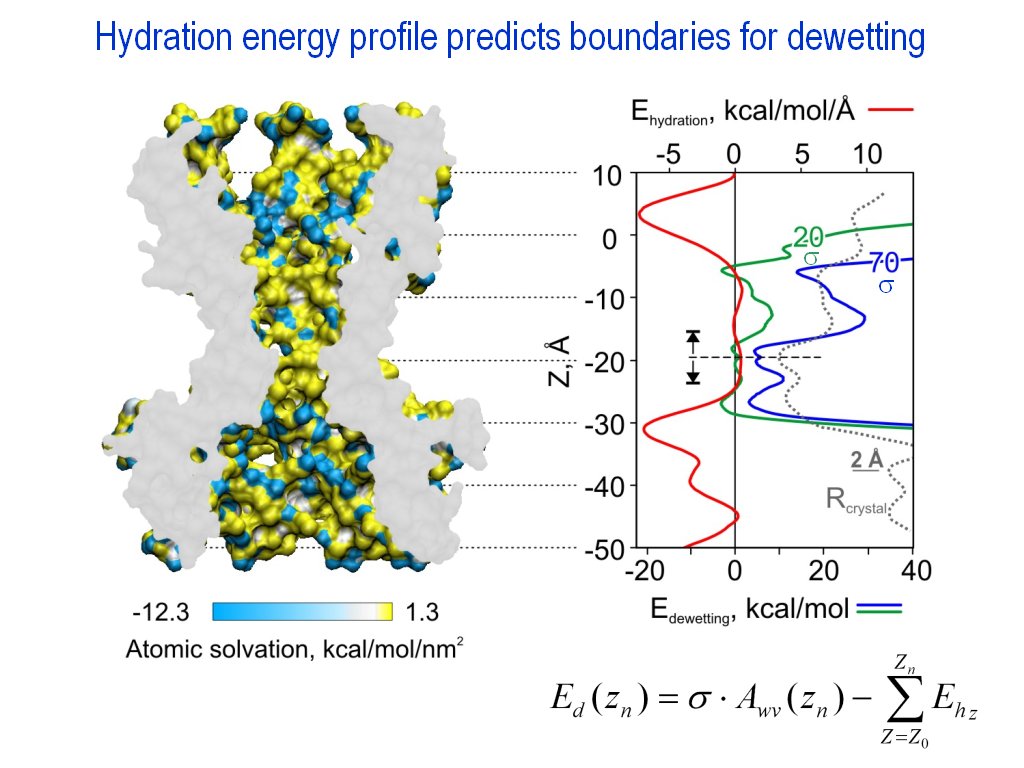
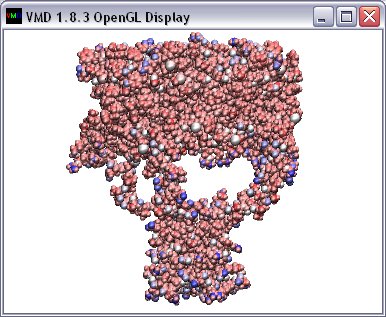
For PDB structures containing
some values in beta or charge (or other) column (|||image,
MscL colored by the atom hydration energy
contained in the beta column), the molecule can be divided
into slices normal to some axis and sum of the values within every
slice can be calculated. In this manner profile of hydration energy
or net charge along the channel axis can be calculated (|||image)
(profile can be smoothed using PDBAN, see
below) |
|
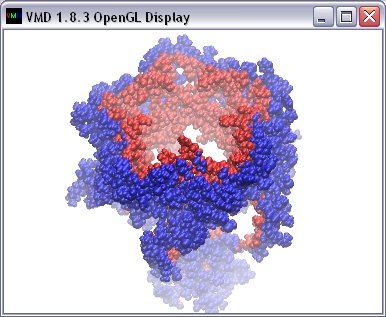
Optionally only atoms marked by
some value in another column can be considered, e.g. only atoms
facing the pore interior, as marked by -1 value in the occupancy
column, will be added to the pore hydration energy profile (|||image) |
|
Both linear (along the axis) and
circular (around the axis) profiles can be computed, so that
distribution of hydrophobicity around the channel can be estimated. |
|
|
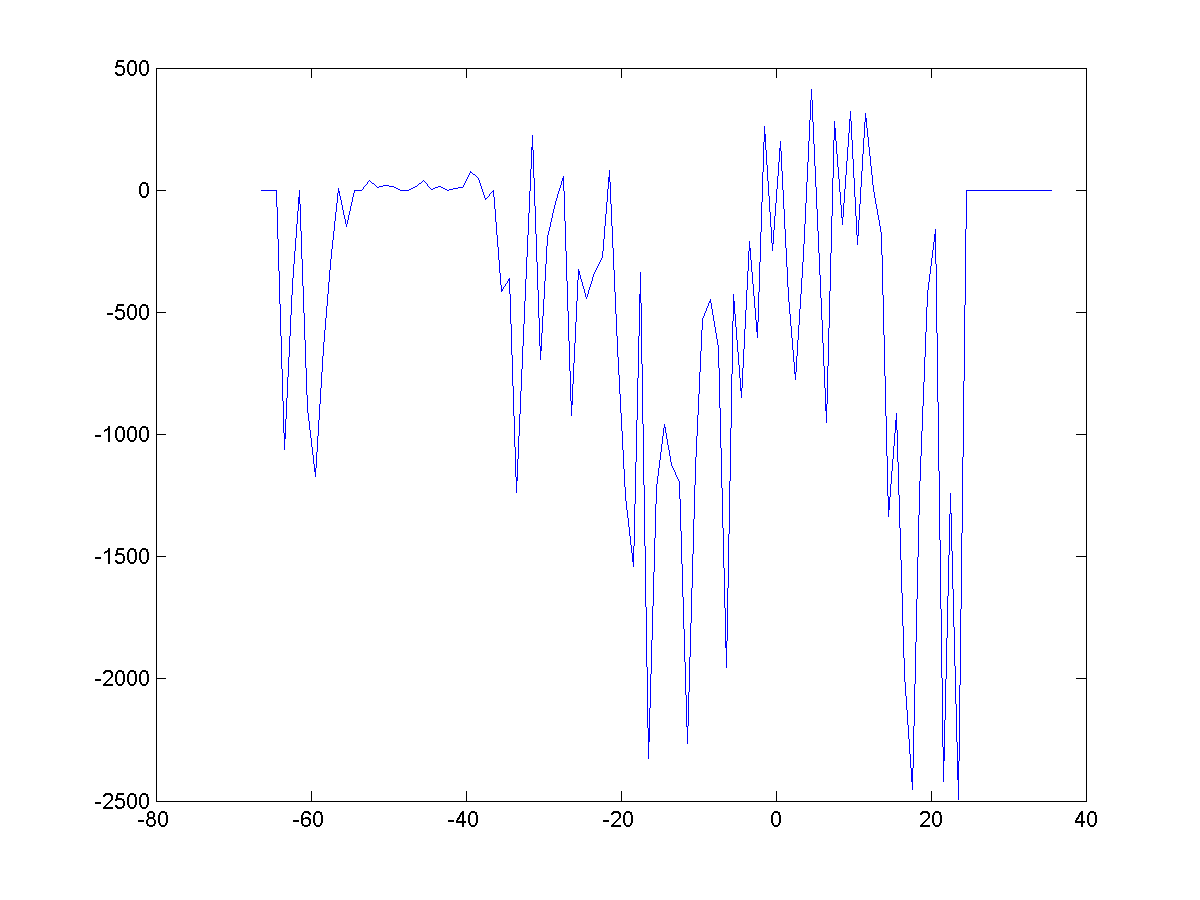
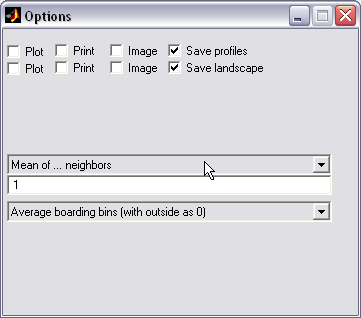
Property profiles averaging (|||image)
|
Original property profiles are
usually rough with 1-Angstrom resolution (|||image).
They can be smoothed to imitate atoms thermal motion and reveal
general features (|||image) |
|
Running average,
triangular-shaped average, normal distribution or arbitrary neighbor
coefficients algorithms can be used for profile averaging. |
|
Arbitrary degree of averaging
can be used |
|
Averaging for circular profiles
is available |
|
|
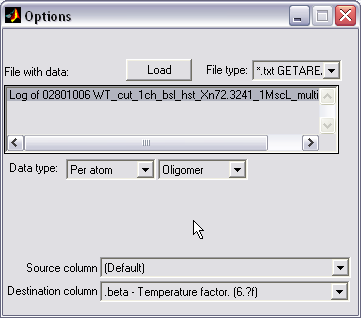
PDB column replacement (|||image)
|
External data (from the text
file or GetArea output file) can be introduced into PDB file. It can
be used to combine calculated hydration energy per atom GetArea with
the atomic coordinates contained in PDB |
|
Arbitrary column can be copied
from one PDB file to another. |
|
Batch processing for file lists
is available |
|
Data per individual atom or per
whole residue can be used and spread over all residue atoms. Data
per one monomer can be spread per whole homooligomer. E.g. In this
way evolutionary conservancy data per residue per monomer can be
properly spread per every atom (for future visualization and
calculations) |
|
|
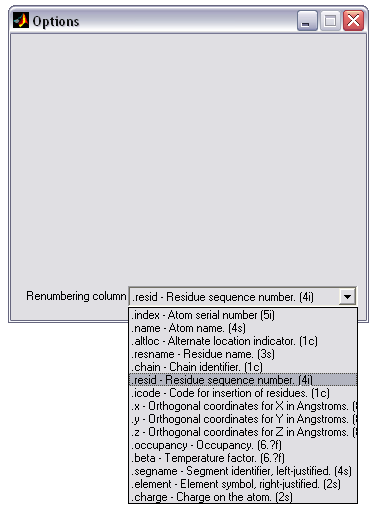
PDB residues renumbering (|||image)
|
Sometimes during model building
in external programs the same block of atoms (e.g. water cube) is
duplicated several times over the system, thus leading to duplicate
residue numbers for the same segment name. It presents a problem for
PSFGEN program. It can be solved by using this renumbering mode of
PDBAN |
|
Batch renumbering is available |
|
|
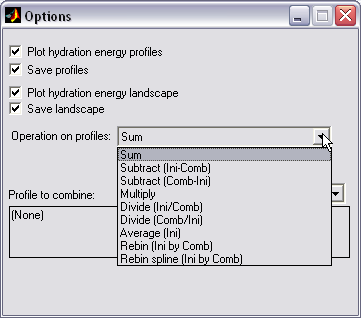
Property profiles combining (|||image)
|
Different property profiles can
be computed with the previous options of HISTAN (e.g. hydration
energy profile and slice surface area profile). They can be combined
in certain manner to estimate some derived property profile (e.g.
energy divided by area to estimate HE density profile) |
|
Profiles can be added, subtracted,
multiplied, divided, rebinned (to produce the same number and
location of bins in two profiles) or rebinned with spline
interpolation |
|
Batch combining is available |
|
|
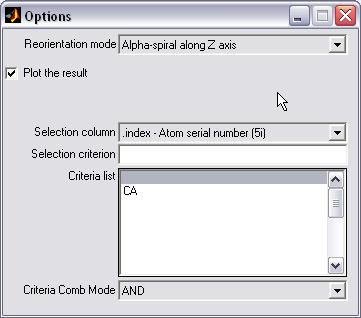
PDB structure reorientation (|||image)
|
PDB structure can be
automatically reoriented by the combination of criteria. E.g. bundle
of alpha-helices can be aligned along the z axis using the rings of
selected alpha carbons as a criterion |
|
Directed random search algorithm
compatible with arbitrary atoms combinations is used |
|
|
PDB property 3D averaging (|||image)
|
Some properties, like atomic
hydration energies, are distributed quite non-homogeneously on the
protein surface. This makes it difficult to grasp visually. With
this option the properties of individual atoms can be averaged among
them and reintroduced into arbitrary columns of PDB file, so in can
be used in external visualization programs |
|
Optional inclusion of only
desired atoms (marked by certain values in the indicated column), so
hydration energy or charge can be averaged only among pore-facing
atoms) (|||image) |
|
Optional usage of some column as
a multiplying coefficient, so that property can be distributed
proportional to the exposed area of the atom |
|
Additive, averaging and weighted
averaging methods are available |
|
|
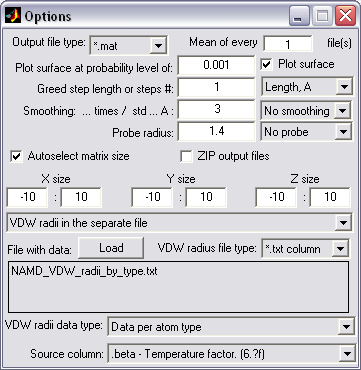
Volumetric data creation (|||image,
image)
|
PDB coordinates can be used to
create 3D volumetric density arrays. These volumetric data can be
used later in other PDBAN modes for pore crossectional area
calculations (|||image,
image),
surface (|||image),
or density (|||image)
visualizations. |
|
Volumetric data can be created
as an average of multiple input files, reproducing time-averaged
density |
|
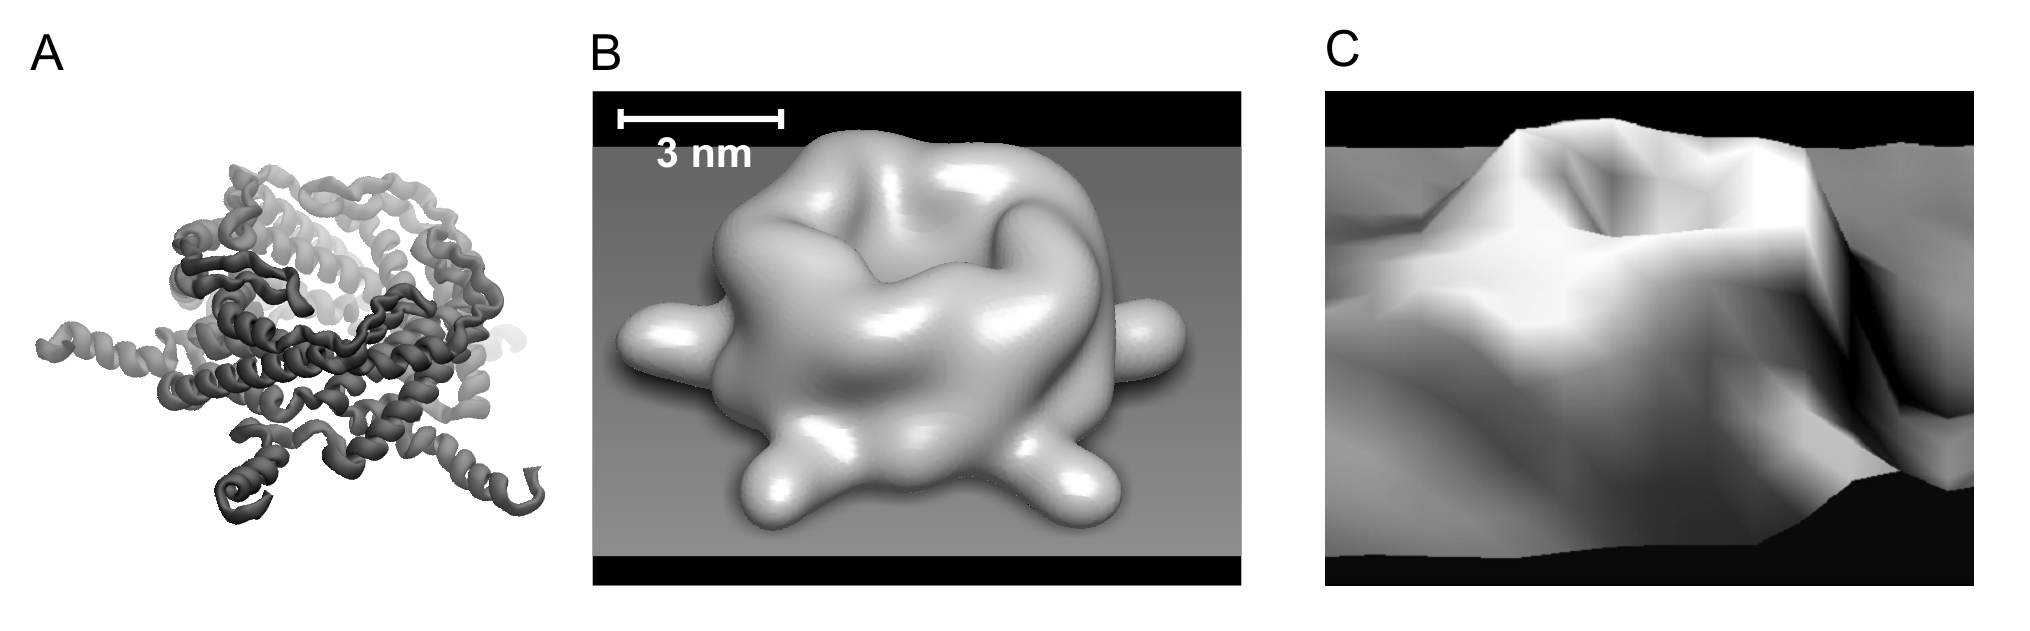
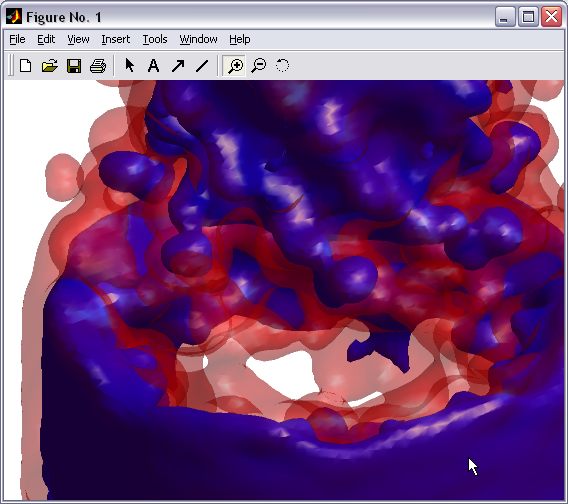
Volumetric data can be smoothed
in space reproducing thermal motion of atoms (using normal
distribution or multistep nearest neighbor averaging). It can be
used to enhance principal structure geometry in visualization purposes
(|||image)
and for virtual 'reconstruction' of low-resolution AFM images
(|||image) |
|
Arbitrary sets of VDW radii can
be supplied for volumetric data creation |
|
VDW surface, surface created by
the spherical probe center or probe surface can be used. Probe
radius can be arbitrary |
|
Automatic or predefined size and
step of volumetric greed |
|
Batch processing and ZIPped
input/output of the files |
|
Optional output in the Matlab
binary or plain text formats |
|
|
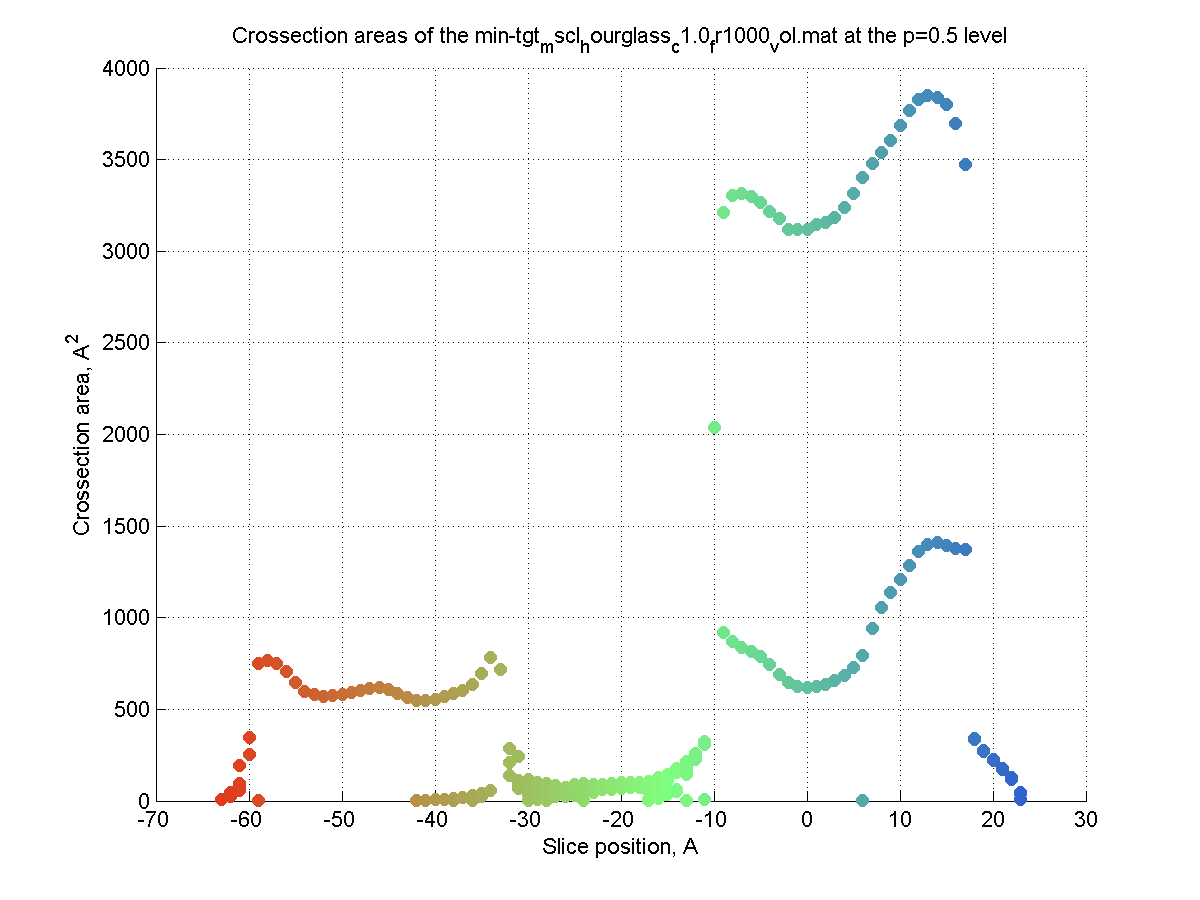
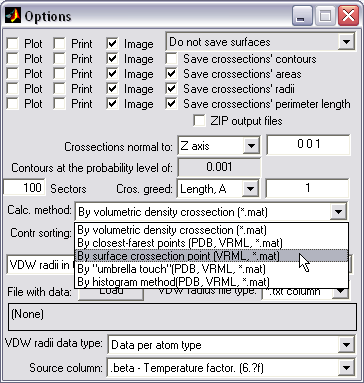
Crossection area calculation
by volumetric/PDB/VRML data (|||image,
image,
image)
|
Volumetric (preferable), PDB,
and externally created VRML surfaces (|||image)
can be used to compute channel crossectional areas profiles |
|
Choice of 5 methods of
crossectional area calculations (some are specific to certain input
file formats) |
|
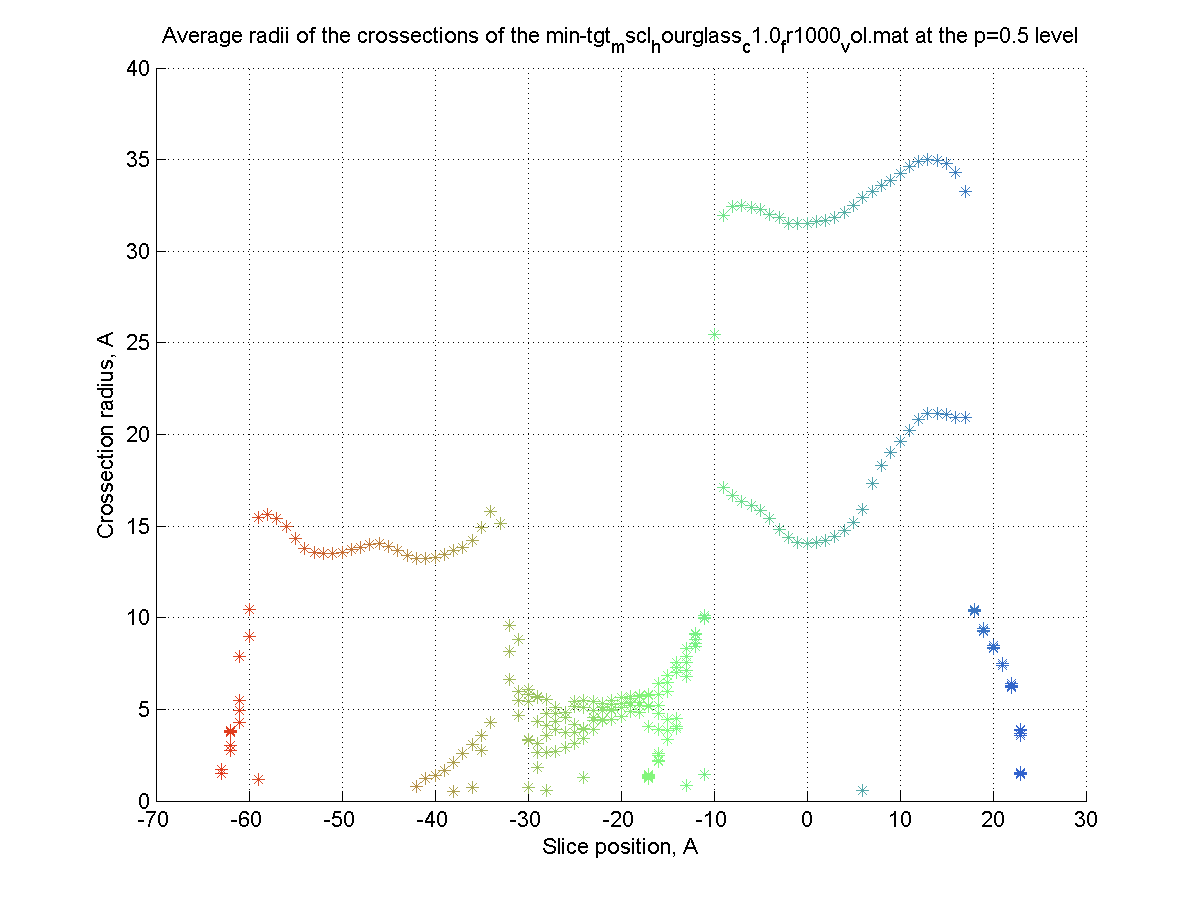
The surface is created (|||image),
then divided into slices (|||image)
and crossection areas (|||image),
effective radii (|||image),
and perimeter lengths are computed (|||image) |
|
Three methods of crossection
areas sorting are available - it facilitates postprocessing of the
output in the external spreadsheet programs |
|
Arbitrary orientation and step
of crossection planes set |
|
Batch processing is available |
|
Option to plot results on
screen, automatically save text files and images, or send them to
printer |
|
Optional output of the
triangulated channel surface in plain text format (e.g. for the
import of calculated averaged surface into VMD) |
|
|
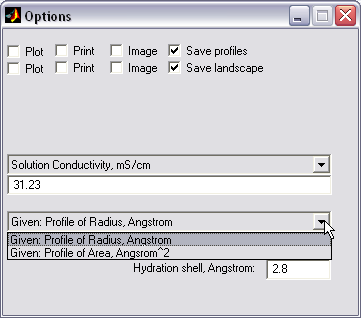
Channel conductance
calculation by radius profile (|||image,
image)
|
Provided the channel pore
crossectional area profile or crossectional radius profile was
computed, and conductivity of the medium is indicated, the pore resistance
profile can be computed in Hille's approximation (|||image).
The method works fine for the large nonselective pores (like MscL,
MscS or hemolysin) |
|
Ion radius size and hydration
shell thickness can be taken into account and subtracted from the
effective pore radii |
|
Pore access resistances are
taken into account, and the total channel resistance is estimated |
|
Output results can be saved as a
plain text files |
|
Batch processing is available |
|
Option to plot results on
screen, automatically save text files and images, or send them to
printer |
|
|
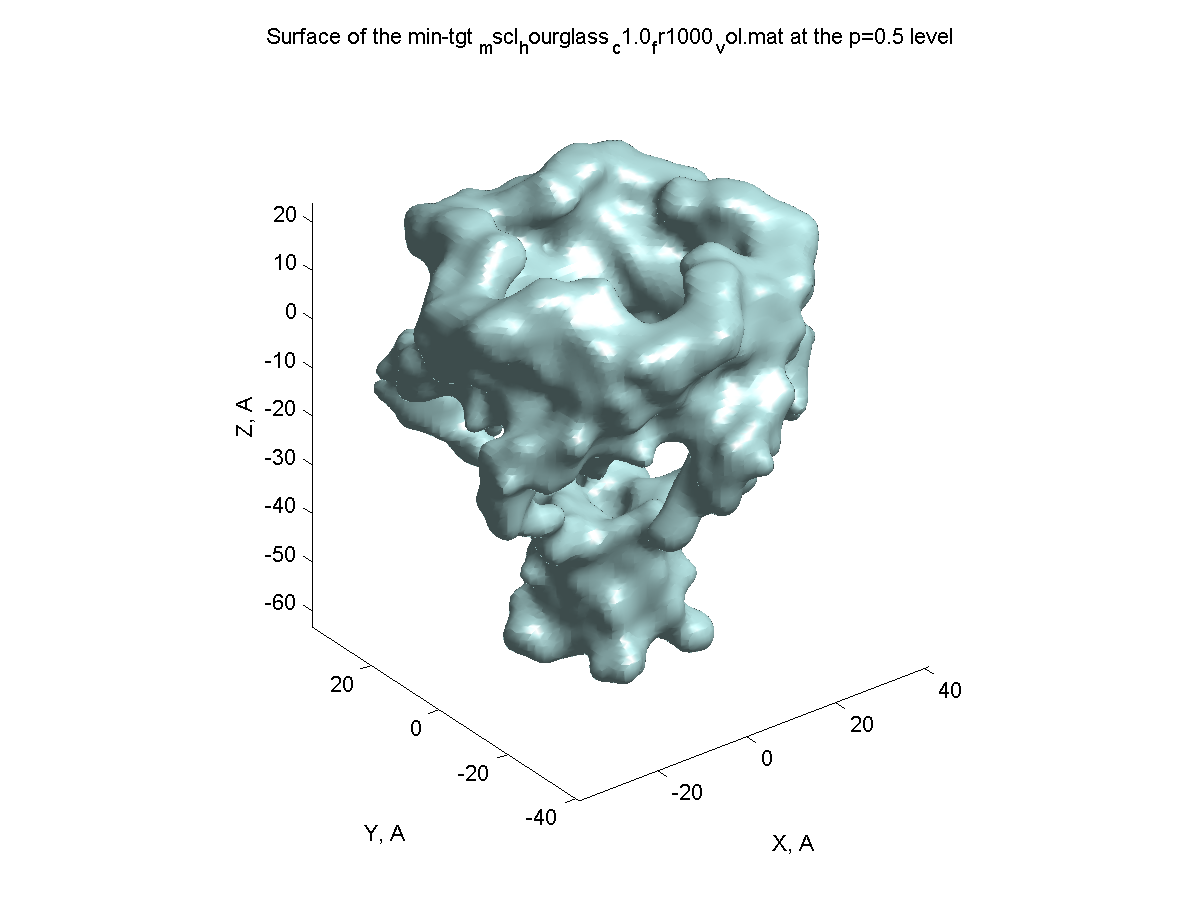
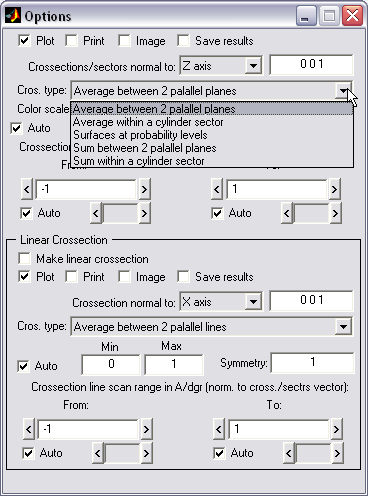
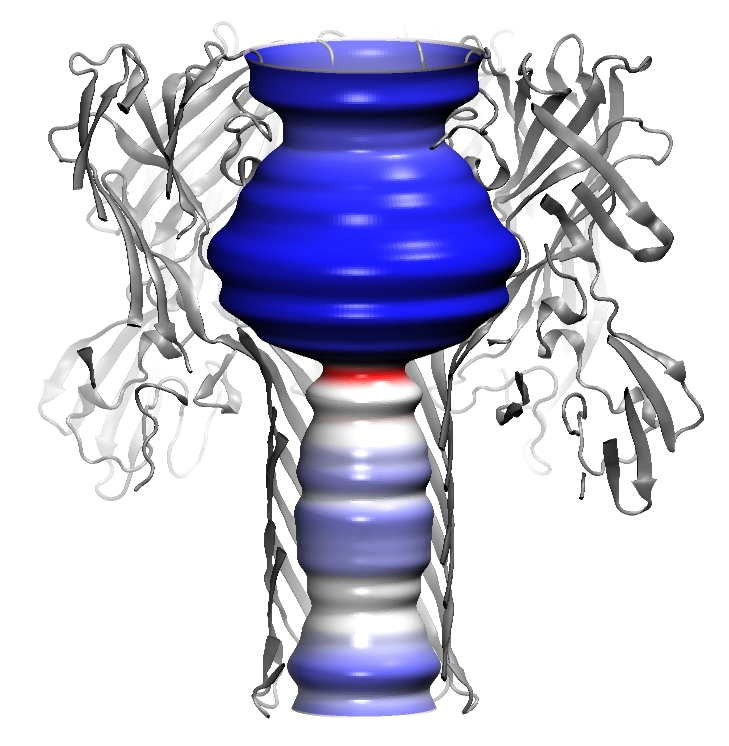
Volumetric data visualization
(|||image,
image)
|
Volumetric data calculated in
PDBAN can be visualized with a broad set of representations (|||image) |
|
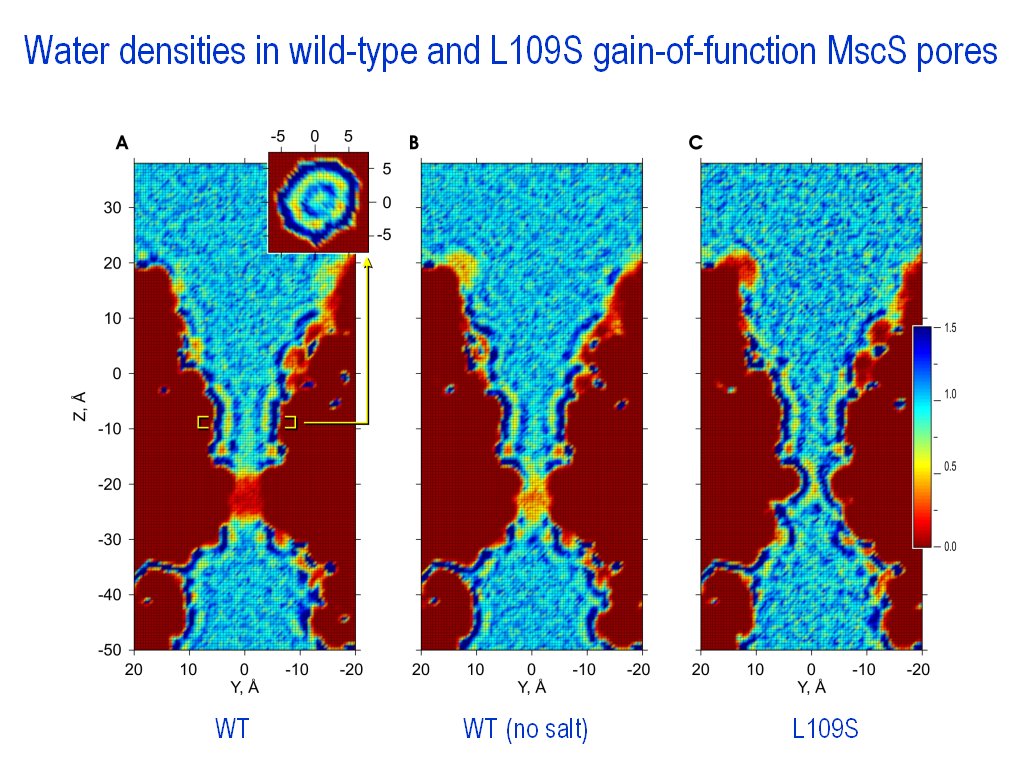
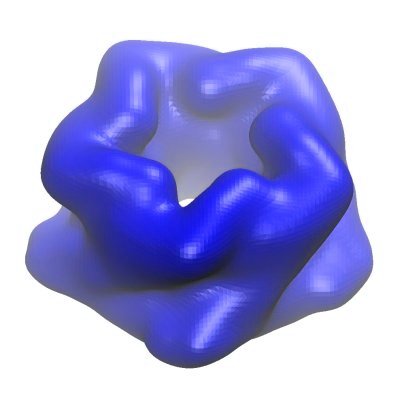
Surfaces can be created at the
given levels of density. Can be used for channel surface
visualizations (|||image)
and for representations of 3D distributions of water density in the
channel (|||image,
image). |
|
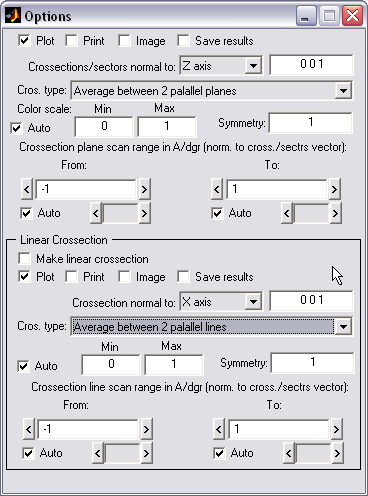
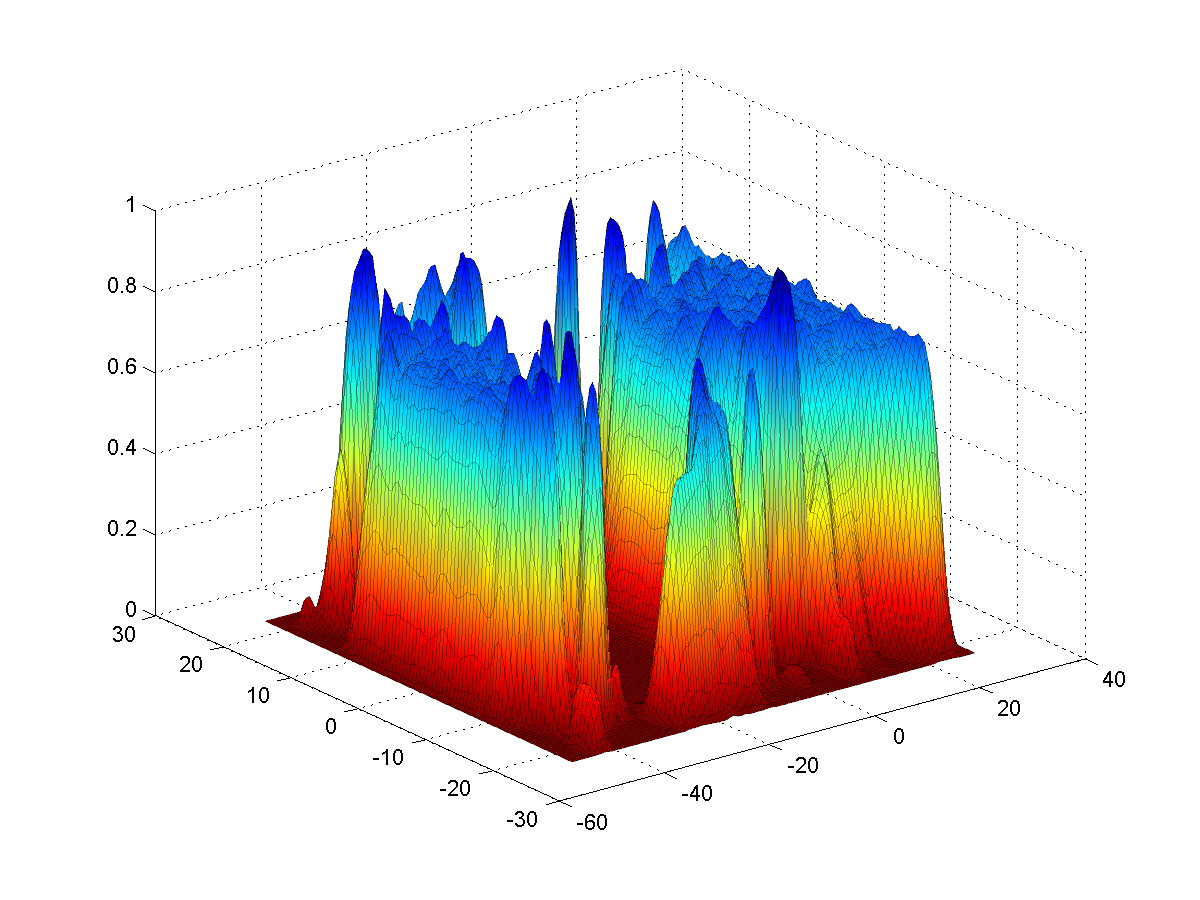
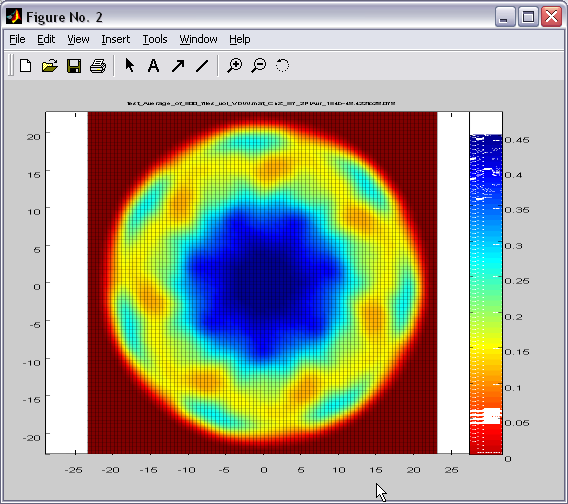
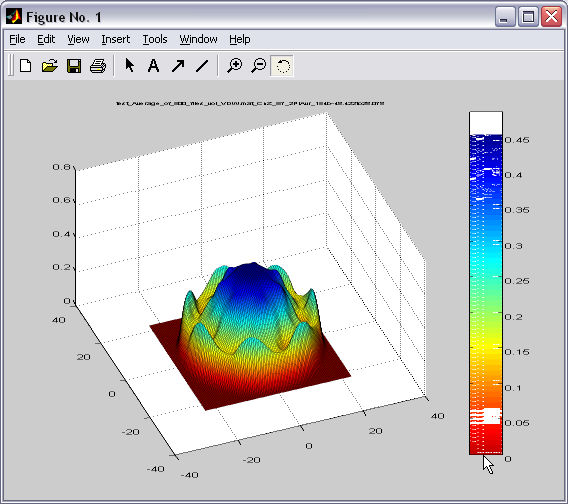
2D density maps can be computed
as an average or sum between 2 parallel planes. Similar maps can be
created for the angular sector created by two intersecting planes.
Map (|||image)
or landscape (|||image)
representations are available |
|
3D data can be averaged with
arbitrary degree of rotational symmetry (|||image,
image) |
|
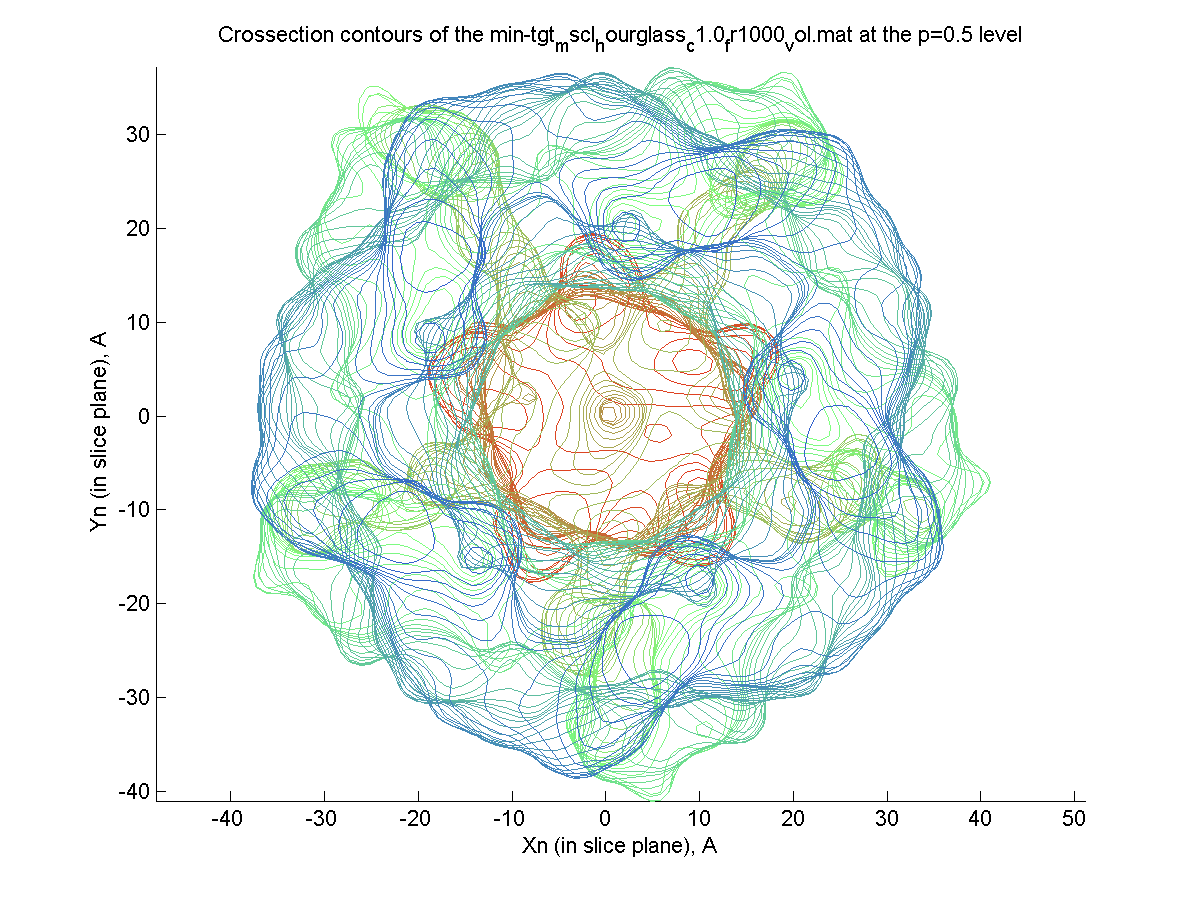
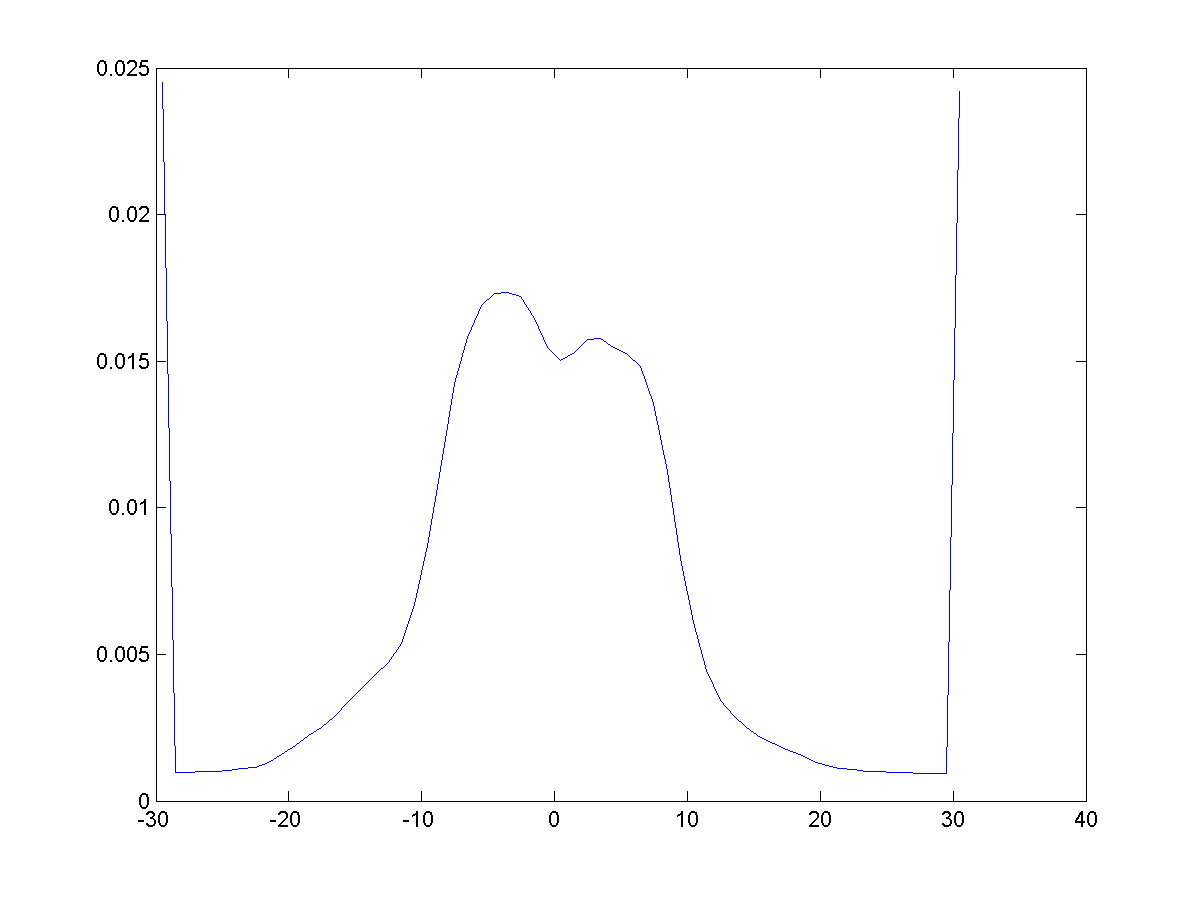
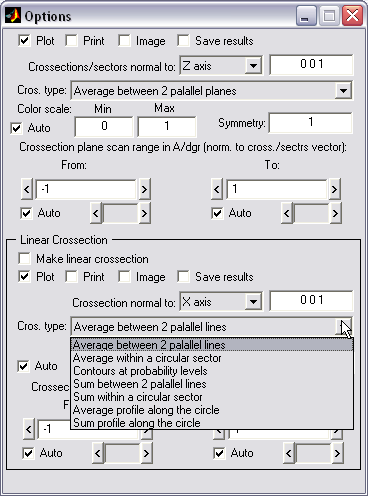
Linear profile can be created as
a crossection of 2D map (|||image),
both linear and circular variants are available, as well as contours
at the desired probability level. Optional averaging over 2D region. |
|
|
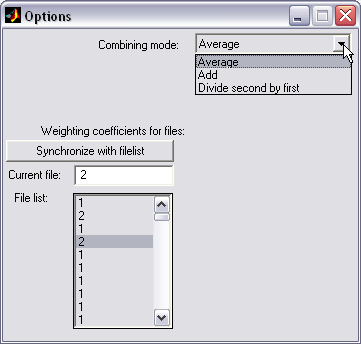
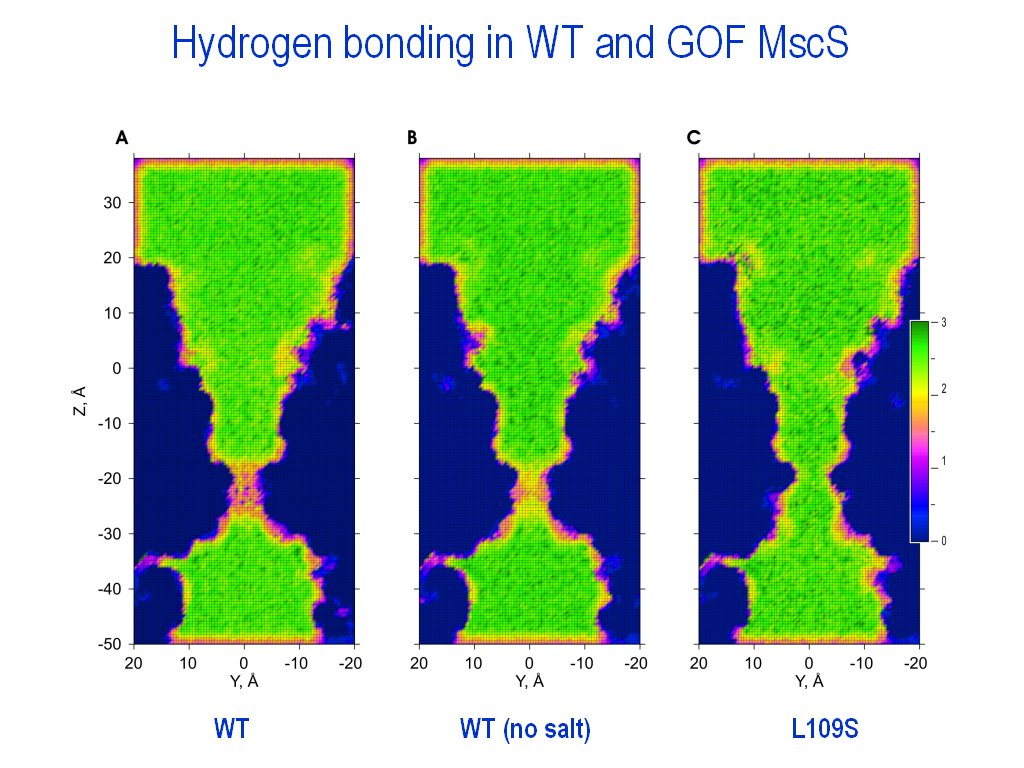
Volumetric data combining (|||image)
|
Different 3D volumetric datasets
can be computed with the previous options of HISTAN (e.g. total
number of hydrogen bonds in some volume and water density there).
They can be combined in certain manner to estimate some derived
property profile (e.g. number of hydrogen bonds in space divided by
the water density will produce the degree of water H-bonding when it
occupies the selected area (excluding time moments of
dewetting) (|||image)) |
|
Profiles can be averaged, added,
or divided |
|
Profiles can be scaled by
arbitrary weight coefficients (e.g. to compensate for the different
simulation times over which hydrogen bonds were counted) |
|
Batch combining is available |
|
|
|
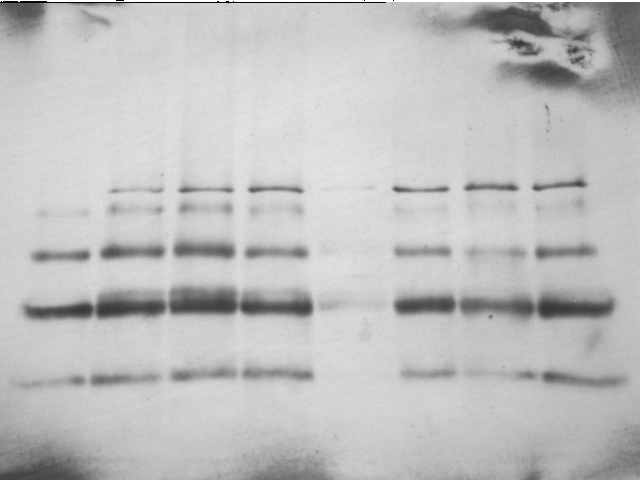
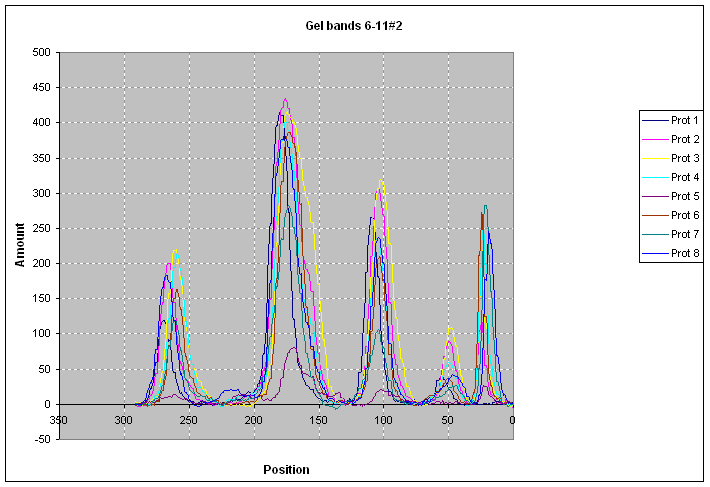
GELAN - program for quantification of protein bands on
the gel
electrophoresis images
 .
It was used for open MscL crosslinking analysis in Betanzos
et al., 2002. .
It was used for open MscL crosslinking analysis in Betanzos
et al., 2002.
General program features:
|
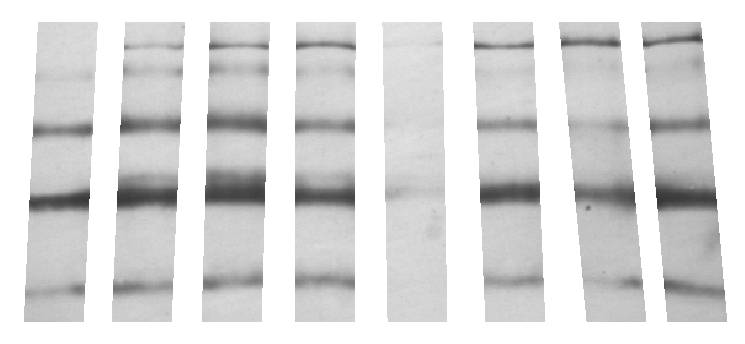
Reads gel images in the BMP
or TIFF formats (|||image).
Images should be prepared to indicate columns (see included ReadMe.txt
file) (|||image). |
|
Output consists of text
files containing band width, total amount of darkness, and protein
concentration |
|
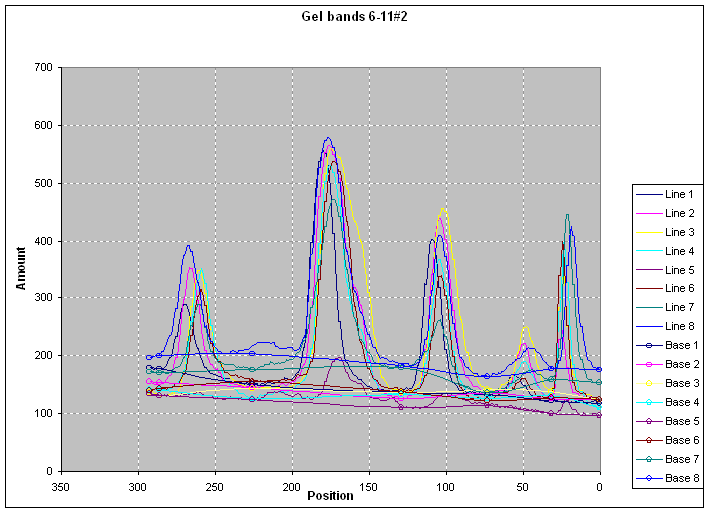
When imported into any
spreadsheet program they produce digitized profile of gel darkness (|||image) |
|
After proper baseline
correction (|||image)
protein content profiles (|||image)
and histograms (|||image)
can be computed.
|
|
A couple of snapshots of VMD script ( )
and NAMD output ( )
and NAMD output ( )
with highlighted syntax. )
with highlighted syntax.
You can find instructions how to make and use custom syntax highlight files with
Crimson Editor here.
Archives with the custom syntax files we have prepared:
|
Expanded
GETAREA library of atom types - it is compatible with wider range of PDB
structures, including PDBs created by PSFGEN
with CHARMM22 topology settings. |
|
Atomic solvation parameters by Wesson and Eisenberg
|
|
Script for MS WORD (written in
MS Visual Basic) for correction long (4-letter) atom names in PDBs produced
by PSFGEN or VMD to make them readable by GETAREA. The script can be
inserted into MS Word template (e.g. through
Tools->Macro->Macros->Edit) |
| Startup
file for VMD (replacement for vmd.rc file under Windows, and vmdrc.
under Linux)
VMD reads and executes this file on startup. Our startup file contains big
set of predefined graphical presets, views, utilities and small scripts,
that may be convenient to have ready to use right away - with single key
press (from the OpenGL window with graphics) or as a short text command
issued from the Tk console. Some of these scripts a written by Andriy
Anishkin, and other are selected scripts from the VMD Script Library
- either in the original form or modified. Although this startup is a
somewhat bulky, it is easy to transfer between different computers and does
not require installation of any additional components (except for the
'orient' script). Here are the main features of the startup file (full
list of features with screenshots is also available).
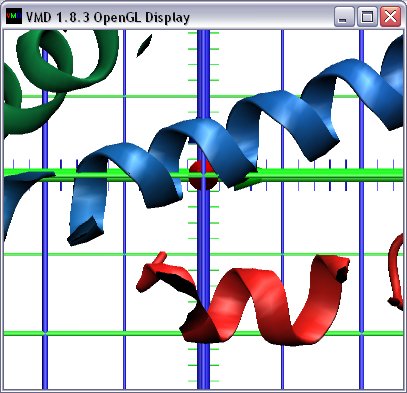
| 3D on-screen grid facilitating visual estimation of molecule
dimensions (|||screenshot) |
| Set of predefined (on keys) views from x, y, and z directions
etc. |
| Coloring the protein (using the beta parameter) by several different
hydrophobicity and amino acid property
scales (58 in total) (|||screenshot) |
| Single-command creation of protein mutant structures (using PSFGEN
embedded into VMD) (|||screenshot) |
| Single-command symmetrization of the thermally-disordered protein
structure (|||screenshot) |
| Embedded morph script (by Andrew Dalke), modified to make linear
interpolation between multiple frames |
| Embedded sscache, orient and vmdcollab scripts (See acknowledgements
in the startup file comments)
|
|
|
coordinates2dcd
- Script reading coordinate files (in any VMD-readable format - NAMDBIN, PDB, DCD, etc.), adding them all as frames in trajectory and saving the trajectory in peaces (to avoid extremely big DCD files).
Inspired by John Stone's 'animatepdbs' script. Expanded to handle file masks (similar to
'ls' command) without specification of the first and last files in sequence
(autodetect). For big file sequences can automatically wrap them into trajectory pieces by
'outFrames' frames number.
Usage: coordinates2dcd <filesPath> <fileNameFormat> <|fileType> <|outFrames> <|start> <|end> |
|
COORs2DCDs
- Similar to the previous script. This script finds all the files fitting into the filemask, e.g. "*.vel *.coor *.pdb" (search may be recursive into subfolders). Then it converts them individually into DCD format (one single-frame DCD per one file). It can (optionally) delete originals. Useful when you want
in one step to free up some space, since DCD takes 2 time less space than
the *coor or *.vel, and about 6 times less that PDB. Be careful with PDBs since DCD will retain only coordinates and will discard all other information (atom names, beta and occupancy fields etc.). |
|
count_atoms_in_selection_of_trajectory_for_filelist
- This script counts atoms within selection for all the frames of the trajectory and records results as a separate text files corresponding to the files in the filelist.
Also script extracts 1 parameter value (e.g. Z coordinate) for every atom in selection for every timestep |
|
count_h-bonded_water_bridges
- This script counts water molecules which is binded with more than one other residue (i.e. functions like a bridge) within selection for all the frames of trajectory and records results as separate text files corresponding to the files in the filelist. |
|
create_trajectory_from_residues
- Script to align all the residues in the selection (suggesting all the residues have the same atoms number), sort by RMSD, and save them as a trajectory (one residue - one time frame. It imitates dynamics of the single residue based on the
single multiresidue snapshot. For multiple timesteps it repeats the operation for every timestep and appends them all in one long DCD trajectory. |
|
draw_channel_cylindrical_surface
- Script to draw rotational (along z axis) surface, e.g. surface approximating average channel radius. It reads text file with 2 columns of data, separated by single spaces (z and radius), or 3 columns (z, radius, color). Color, if specified,
should be integer from 17 to 1040. File should have 1st line with column headers (it is ignored).
(|||screenshot),
It was used in Sukharev
and Anishkin, 2005 |
|
draw_triangulated_surface_from_file
- Script to read and draw triangulated surface. It reads text file with 9 columns of data, containing coordinates of a triangle, separated by single spaces (x1 y1 z1 x2 y2 z2 x3 y3 z3). Useful when you have some surface calculated in the external program, e.g. Matlab, and want to overlap it exactly with the structure in VMD.
(|||screenshot) |
|
extract_all_frames_as_PDBs_for_filelist
- This script extracts the selection of atoms for all the frames of trajectory as separate PDB files (one file per frame).
Updates the selection every frame (in can have different number of atoms
every timestep). Useful when you want to analyze the selections later in
some external program, like Matlab. |
|
extract_all_frames_H-bonds_as_XYZs_for_filelist
- This script extracts coordinates of atoms forming an H-bond within selection for all the frames of the trajectory as separate XYZ (donor line, acceptor line, etc) files (one file for each entrance in the filelist).
Useful for creation of hydrogen bonding maps (see Anishkin
and Sukharev, 2004). |
|
mark_non-channel_atoms_by_1_and_channel_by_-1__filelist
- Script for autodetection of the protein atoms on the outside-facing surface (lipid-facing surface of the membrane
channel; atoms will be marked by 1 in occupancy field) and inside-facing surface (pore-facing surface of the channel or protein
core; marked by -1). Channel is supposed to be oriented such that the direction normal to membrane plane will be along z axis.
Can be used as one of the steps of hydration energy profile calculation. (|||screenshot) |
|
radial_distribution_for_atoms_in_selections_of_trajectory_for_filelist
- This script calculates the distance distribution for atoms within selections for all the frames of trajectory and records results as separate text files corresponding to the
input files in filelist. Can be used for ion-'water oxygen' or water 'oxygen-hydrogen' etc. correlation function. |
|
reposition_atoms_along_radius_and_average_multiple_selections
- Script to reposition all the atoms in specified selections, rotating them around z axis so that they all align along the y axis, i.e. from {x y z} to {0 r z}, where r - radial distance from the atom to the z axis. Then a <smoothed> average is calculated and plotted as semitransparent spheres.
(|||screenshot) |
|
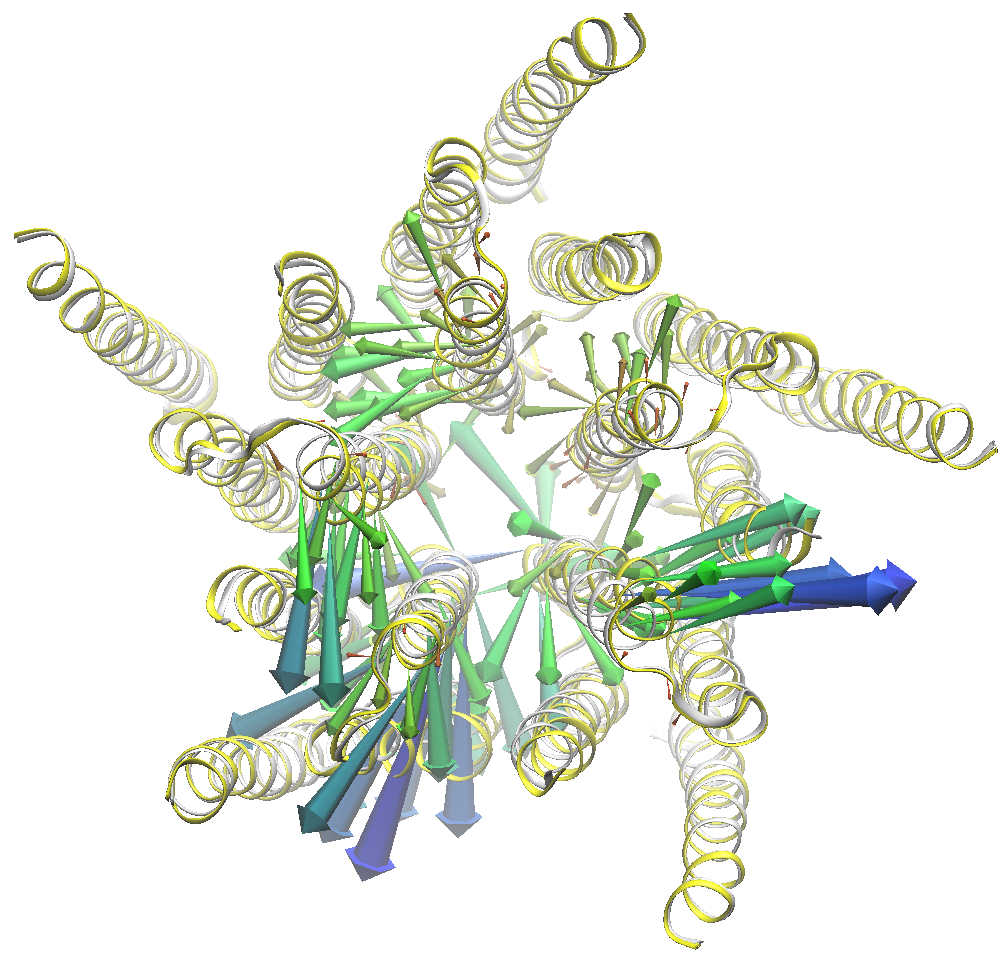
show_forces_as_arrows
- Script to estimate forces acting on harmonically restrained atoms in simulation. Supposing that one frame has coordinates of
restraint targets, script compares these two frames of trajectory, calculates force acting on restrained atoms (according spring constants in the BETA field), puts the value into OCCUPANCY field and draws the color-coded force arrows.
(|||screenshot) |
|
summarize_namd_logs
- Script to find files fitting into filemask, then find in every file lines with certain beginning, and extract patterned information from those lines. |
| Tcl script for starting long
recursive NAMD simulation under Windows or Linux platforms |
| NAMD
configuration file for long simulations
(for use with the Tcl start script above, automatically
performs a long simulation (e.g. 10 ns) as a numbered set of shorter
simulations (e.g. 200 ps, to reduce file size and facilitate trajectory
management), and autoresumes a stopped simulation in case of crash)
|
| Tcl script for
performing set of NAMD simulations with gradually changing restrains |
| NAMD
configuration file for NAMD simulations with gradually changing
restraints |
| VMD script for
creating constant force or harmonic spring constant and target files to
implement gradually changing restraints simulations. |
| Configuration
file for the above VMD script. All 4 above files are required to perform
simulations with gradually changing harmonic restraints.
As an example one can think of gradually increasing radial
stretching force applied to the channel external surface, combined with
twisting motion and simultaneous expansion of the internal part of the
protein, imitating a set of membrane- and hydration-derived forces with
conformational distortions developing in the protein. |
| VMD
script for automated consolidation of the output fines (fuse all the
coordinates into DCD trajectories, |
| VMD
script for consolidation of the output files after simulation was
completed. It can be started with this
startup file
|
| VMD
script automatically adjusting (scaling down) charges in PSF topology
file according to the degree of exposure of atoms in the PDB file and
dielectric permeability profiles for the medium.
Can be used in vacuum simulations to imitate screening effect
of phospholipid membrane near the protein, and water around and inside the
channel. |
| Dielectric
permeability profiles for the membrane and water along z axis for use
with the script above. |
|
Models of E. Coli
MscL in the closed,
expanded
and open
states

(based on the Dr. H. Robert Guy models (Sukharev
et al., 2001) with N-terminal domain in the open state modified
according to (Anishkin
et al., 2003); PDB format) |
|
PSF
topology and DCD
trajectory files of targeted energy minimization in vacuo between
the closed and open states of MscL. It resembles the modeled trajectory of
MscL gating and the gating pathways observed in all-atom molecular dynamics
MscL simulations. |
|
Resting MscS |
|
Model of inactivated MscS |
Movie -
Model of MscL opening
|