Evolution Concept Map
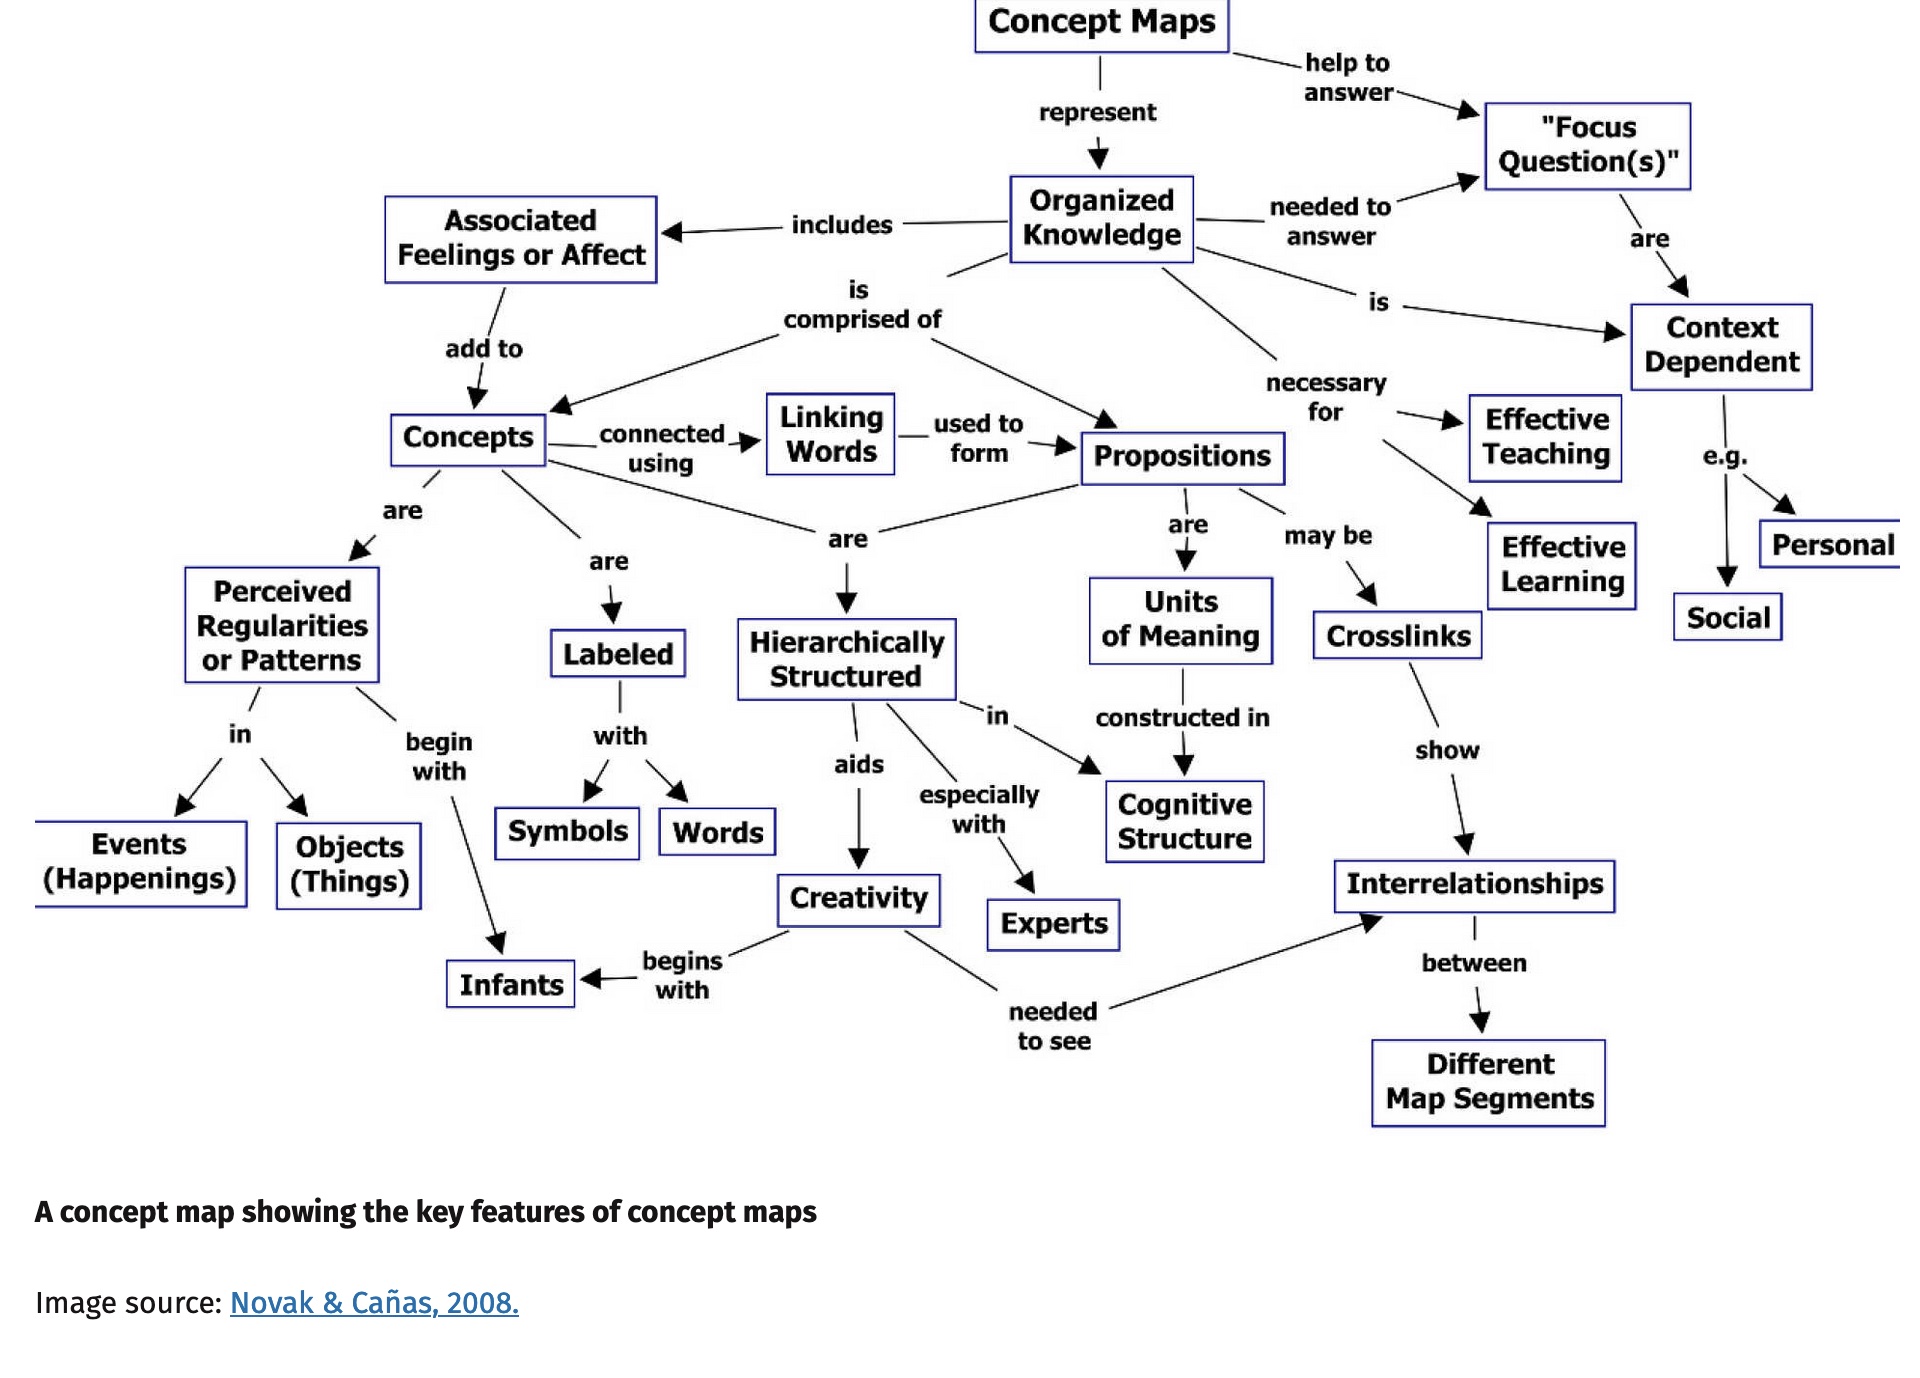
A concept map is a diagram that represents concepts and the relationships between them. The concepts are often shown as boxes or circles, and the relationships between them are shown as arrows. The arrows are usually labeled with a description of the relationship.
For example:

Important things to keep in mind when constructing a concept map
- Each arrow needs a description of the relationship
- A concept can have multiple arrows coming from it or going to it (in this case, that would be expected because the relationships are complex)
- Interlink the concepts as much as possible
- It can be helpful to organize your concepts according to a theme (e.g., a time series, or very general to very specific)
Design a concept map to answer the question "Why did mammals survive, while the remaining synapsids went extinct?" Here are some concepts you may wish to use:
- Small body size
- Enlarged dentary bone
- Changes in jaw articulation
- Heterodont dentition
- Secondary palate
- More efficient respiration
- Fur
- Endothemy (internal heat production)
- Big brains
- Hide from dinosaurs
- Nocturnal activity
- Well developed sense of hearing
- 3 ossicles
- Enlarged olfactory lobe (part of brain devoted to smelling)
- Well developed sense of olfaction (smell)
- Efficient food gathering and processing
- Turbinal bones (very small bones in nasal passages that are covered with olfactory receptors)
Feel free to incorporate other concepts as well to create a coherent concept map.


