Sequence Analysis Instructions
In order to predict your drug metabolizing phenotype from your CYP2D6 gene sequence, you must determine:
1) The assembled sequence from your two opposing sequencing reactions
2) If your PCR product even represents the human CYP2D6 gene,
3) The location of your sequence within the CYP2D6 gene,
4) Whether differences between your alleles and CYP2D6*1 sequence represents sequencing errors or polymorphisms in your sequence,
and
5) The effect(s) of any polymorphisms on CYP2D6 protein sequence.
As you analyze your gene sequence, copy and paste your analyses and results into a text file for your final lab report. If some factor, like the quality of your sequence, prevents you from carrying out the complete analysis, your grade will not be penalized—just complete as many of the steps below as possible, and include an explanation of why you could not complete the analysis in your final report. Font appearing in bold green italics describes questions to answer and items to include in your final report.
Part 1: Assembling
your CYP2D6 sequence from both directions
The sequencing reaction only produces 700-800 bases of good sequence. To get most of the sequence of the 1.2 Kbp PCR product, sequencing reactions were performed from both directions on the PCR product. These need to be assembled into one sequence using the overlap of the two sequences. In order to assure that it is going in the forward direction, it is best to derive the reverse complement sequence from the reverse sequencing file. Take the text file and paste it into a program like http://www.bioinformatics.org/sms/rev_comp.html. Make sure that there are no hard returns in the sequence so it appears as only one line in the box. A hard return indicates a second sequence and so the program would scramble the sequence. Hit a reverse complement and copy the result into your results as Reverse sequence reverse complement (reverse-RC).
To assemble the forward and the reverse RC sequences into one contiguous sequence, you will look for where they overlap and then splice them together at the overlap. You can do this in a Word document by eye, or you can use a program. One assembly program is CAP3 at http://pbil.univ-lyon1.fr/cap3.php. Paste both the forward and the reverse-RC sequences into the box. You need FASTA format in this input. Label each sequence block with a > caret mark. Thus add” >forward sequence” in a separate line above the forward sequence, and “>reverse sequence” in a line above the reverse-RC sequence block. Make sure there is a hard return after these labels and between the sequence block and the next label. After submitting the job, you will get a results page. Clicking on the “Contigs” result will give you the assembled sequence. Check how it did this clicking on the “assembly details” result- it will show the overlapping sequences that were used. Keep a copy of this “assembly details” result since the two sequences may be different in the overlap and you will be reviewing the raw data in the chromatograms which will let you confirm that the best sequence was chosen in any overlap discrepancies.
Paste in the text from the forward and reverse sequence files.
Paste in the reverse-reverse complement (RC) sequence. Paste in the contiguous
assembled sequence you will be using for your analysis.
Part 2: Is your PCR product the human CYP2D6 gene?
Determine
whether your gene sequence matches the published sequence for the human CYP2D6
gene. To do this use GenBank, a nucleotide database run by the
|
|
|
|
|
|
Copy and paste
your sequence into the search box, then click the button that says “BLAST!”
Press this BLAST button to
run the blastn search
On the page
that loads, click the “Format” button, and a new web page will appear.
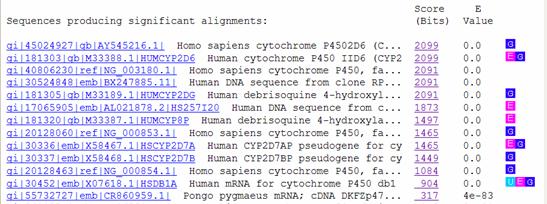
After a few moments, your blastn results will load in the new web page, showing which sequences in the NCBI database most closely match your sequence.
A graphic at
the top of the blastn results page shows where each
match aligns within your sequence. The color of each match represents the
alignment score, or the strength, of each match.
These
lines represent the NCBI database hits that match your sequence and where in
your sequence they match
This red bar represents your
sequence
Below the graphic is a list of
the database hits, including their scores and expectation values (E
values). The score of an alignment indicates how well your sequence
aligns with a given sequence from the GenBank
database, and takes into account such factors as gaps and mismatched
bases. The higher the score, the better the alignment.
E values indicate the significance of a match, and represent the expected
number of random (chance) alignments that would have an equivalent or
better scores than the one given for a particular hit. Smaller E values
correlate to higher alignment scores and thus indicate better matches.
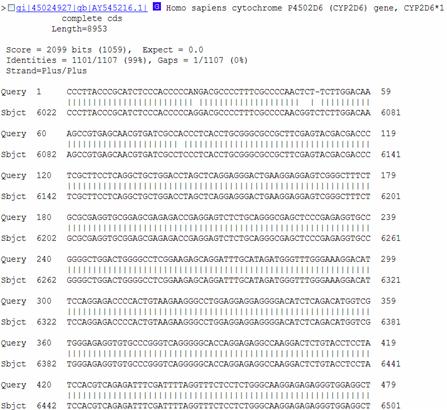
Below the list of hits, the
sequence alignment for each match is presented. This is where you can see
how the two sequences align, including the location of any gaps or mismatched
bases. The alignment score and E value are also given here, along with a
numerical summary of how many base matches and gaps there are in the alignment.
Include
your interpretation of the blastn results in your lab
report. What are the highest 4 – 5 matches? What are their relative
E values? Are they human genes? Is human CYP2D6 the highest
match? If not, discuss possible reasons why not.
Note how BLAST provides a local
alignment- only showing areas that it matched based upon the parameters. You
can see small mismatches within the aligned sequence, but from the base numbers
in the output, not all of your sequence may be shown. A program that provides a
global alignment will try to make the best match over the whole sequence.
Part 3: Identify positions where your sequence varies from
the *1 alleles- checking data for sequencing errors vs. polymorphisms in your
sequence
- The
genomic sequence of CYP2D6 is at
http://www.ncbi.nlm.nih.gov/entrez/viewer.fcgi?val=40806230&db=Nucleotide&dopt=GenBank. Because the human genome sequence was obtained from an individual with the CYP2D6*5 allele (where the entire CYP2D6 gene is deleted), the wild-type CYP2D6 gene was sequenced separately.
Scroll down the page until you reach the sequence of the gene. Notice how each line has the base numbers on the left side. When using a gene sequence for alignment or searching, these numbers in the middle of the sequence become problematic. Therefore, to get rid of these numbers, there is a sequence display option called FASTA. FASTA sequences lack numbers and line breaks. For more information on FASTA format, see http://www.ebi.ac.uk/help/formats_frame.html and click or scroll down to the section on FASTA.
Click here to change the
display option to FASTA
To display the sequence in FASTA format, look for the drop-down menu in the top
left corner of the page—it is next to the word or button that says
“Display.” Change the display option from “GenBank”
to “FASTA.” If the page does not automatically re-load, click on the
“Display” button (if present).
Copy
and paste the FASTA version of the CYP2D6 genomic gene sequence (excluding the top
line of text) into your report for easy access—you can delete it later.
- Several different websites will align sequences for you; one such program can be found at http://multalin.toulouse.inra.fr/multalin/
- In Aligning your PCR sequence with the genomic sequence
of the CYP2D6 gene you will use a slightly modified version of the above
genomic sequence (found at http://chemlife.umd.edu/classroom/bsci415/straney/lab/CYP2D6_genomic_coding.html)
that removed the large portion of the gene
upstream (5’) from the start codon—this will
change the numbering of the bases to be consistent with allele
nomenclature. When you compare your sequence to known
polymorphisms of the CYP2D6 gene, you will use a list of published polymorphisms found at http://www.imm.ki.se/CYPalleles/,
and this site also uses base numbering that begins at the start codon of the CYP2D6 gene.
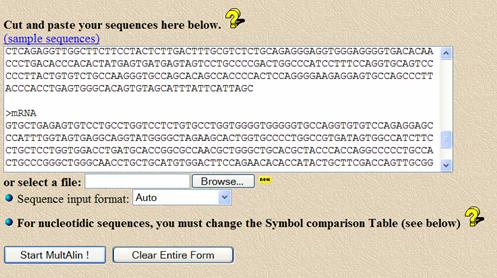
Copy and paste the genomic sequence from the file into the white sequence box in Multalin. Before the sequence, add a line that says “>genomic” to identify the sequence in the search results.
Add a blank line below the sequence
and add the PCR sequence with a separate line above it with a “>” and a
title (such as “>rawassembledPCR”)
Scroll down the page to “Optional
Parameters.” Under the heading “Alignment parameters,” find the drop-down
box that says “Blosum62 - 12 - 2” (a default protein alignment algorithm) and
change it to “DNA - 5 - 0” so that the program aligns a nucleotide sequence
instead of an amino acid sequence. Also, change the “gap penalty at extremes”
to both, it keeps mismatches near the ends from
creating large gaps.
![]()
Click the “Start MultAlin!” button to get your alignment.
The results page will show the sequence alignment as a .gif image, which you can save in your report, or you can choose an option to display the results as an html page, from which you can copy and paste the results as colored text into your report—this feature is helpful because you can easily manipulate the size or font of the text to make it fit in your report, something you can’t do with a .gif file. If colors disappear upon cutting and pasting, you can instead save the html file to your disk, open it up in Word and then save it as a .doc file. Changing the font to a fixed point font (e.g. Courier) makes the line-to-line alignment match.
Another option on the page allows you to change the number of bases displayed per line (the “Maximum line length” default value is 130)—shrinking this value (60 is good) may help keep the alignment’s formatting in your report easier.
The strength of alignment at each base is color-coded to help you quickly visualize differences between the sequences. If you like you can change the colors the program uses to indicate different alignment consensus levels (the default options are black for no or neutral alignment, blue for low alignment, and red for high alignment).
If you see
matches of your PCR product in this alignment that break up your PCR product at
the ends, stop and think if this makes sense. This would indicate that there is
a large deletion in your allele, and an even greater
rearrangement when you locate where the PCR primers are later. The alignment
program can have problems matching the ends of the PCR product if it encounters
mismatches (even with the end gap option), resulting in such a fragmented
alignment. Test this by manually move any ends of the PCR sequence in the alignment
to make a contiguous PCR sequence. Look at this alignment in the following
analysis.
Copy
and paste the alignment into your report. If color fonts
disappear, save the html file, reopen it in Word, and then save it as a Word
document. It is important to change the font to a “fixed” font, like Courier New and change the size of the font to retain the alignment’s
original formatting.
- Carefully examine the sequence alignment for places
where your sequence varies from the full-length genomic wild-type sequence
(the CYP2D6*1 allele). For each nucleotide difference, you will need
to decide whether the discrepancy can be corrected (changed to the
published sequence), whether it is an ignorable error because it occurs
near the ends of your sequence (see below for more information on this
error), or whether it is truly a polymorphic or heterozygous site.
Remember to check the sequence in the overlap portion when you made the
contiguous sequence- the program may have ignored a better base call in the
overlap. Ultimately, after examining all the discrepancies between your
sequence and the CYP2D6 gene sequence, you will make a corrected version
of your allele sequence(s) for use in later analysis steps.
To
determine which type of the above differences you have, you will need to locate
each discrepancy on your sequence’s chromatogram—this is the raw sequence data
obtained by the sequencing machine. To open the chromatogram file, you
will need to download a free software program from http://www.technelysium.com.au/chromas.html
(or Editview for Mac at http://www.appliedbiosystems.com/support/software/dnaseq/installs.cfm).
The sequencing facility uses a similar base-calling program that reads and
interprets the peaks in your chromatogram to give the location and identity of
each base in your sequence. A downloadable program (ApE)
is also available at http://www.biology.utah.edu/jorgensen/wayned/ape/
that can read chromatograms. Use the chromatogram as your source to look for
evidence that you sequence is different than wild-type.
Types of
discrepancies you may encounter in your sequence:
Your sequence differs from the wild-type sequence at one
base. Examine your chromatogram—sometimes the base-calling program
makes errors that you can correct by eye. When examining your
chromatogram, you will see peaks in your chromatogram that are not consistent
with the base(s) that the program interprets.
This base was called as a T when this black peak indicatesthat a G comes before the T, so GGGTTC rather than GG G/T TC
If you should
find similar errors in your chromatogram, go with what the peaks imply should
be the sequence and change your sequence (if necessary) to reflect what the
peaks show. Peaks that differ from the published wild-type CYP2D6 gene
sequence may represent single nucleotide polymorphisms (SNPs)—highlight
or change the color of the base to make it stand out.

Your sequence contains an “N” base. Ns
occur when the base-calling program cannot resolve the identity of the
base. You may be able to correct the N by eye after examining the chromatogram.
However, if you cannot easily identify the base,
evaluate if it is still consistent with the wild-type sequence, given the
uncertainty. If it is inconsistent with wild type, leave it as an N.
These overlapping peaks indicate
that this base is a mixture of two alleles, one with a G (black peak) and another with an A (green peak) at this position
One complicating factor is heterozygosity—you
may have two different alleles that differ by one base at this location.
This will appear as two overlapping peaks in the chromatogram. One of the
peaks may represent an allele with the wild-type (normal genomic) sequence, and
the other peak may represent an allele with a SNP at that location.
Look at
the spacing and width of peaks in relation to other nearby peaks; you may or
may not be able to correct the gap. If you cannot correct the gap, leave
it in the sequence and mark it with a new color or highlight—there are known
polymorphisms of CYP2D6 that have small deletions or insertions.
You seem to have many mismatches in close proximity to
each other, especially near the 5’ or 3’ ends of your sequence. The
first 10-30 and last 100-250 bases of sequence from the machine can be
unreliable and full of uncorrectable errors. Peak broadening makes
counting the number of bases in a string of the same base difficult; as a
result, we will likely only get about 800 bases of reliable sequence from our
PCR product. Again, focus upon looking for clear evidence in the chromatogram
that there is a difference from the wild-type sequence, given this
uncertainty. Use your judgment to determine where this becomes too
unreliable and “chop off” the ends from your final corrected sequence.
After examining the discrepancies between your sequence
and the wild-type CYP2D6 genomic sequence, create a corrected version of your
sequence in FASTA format that incorporates any changes you have made, removes
the ends of your sequence up to where reliable sequence begins, and removes any
gap symbols in your sequence (these will be added back in by an alignment
program later). In positions where you believe there are two possible
nucleotides (like at a heterozygous site), make two versions of your sequence,
one to represent each allele. Include your corrected sequence(s) in your
final report, along with a brief description of the changes you made and reasons
for doing so.
You may wish to run a blastn search with your corrected sequence to make sure
that you did not “over-correct” your sequence. Make sure that the top
hits are to the human CYP2D6 gene.
1 Databases have the mRNA
sequences of CYP2D6 at http://www.ncbi.nlm.nih.gov/entrez/viewer.fcgi?db=nucleotide&val=NM_000106.4.
However, this one corresponds to the *2 allele. Get the *1 allele mRNA
sequence at http://www.chemlife.umd.edu/classroom/bsci415/straney/lab/CYP2D6mRNA.txt
that is in FASTA format. Copy the
FASTA version of the mRNA sequence into your report.
In
your report, make note of the coding region (CDS) of the mRNA sequence by
changing the font color or by bolding the first start codon
(ATG at position 91-93) and stop codon (AAT at
position 1585-1587). Highlight the 5’ untranslated
region before the first ATG.
2. Trim the first 90
bases before the first ATG off your mRNA sequence; this will make the numbering
in the alignment consistent for the polymorphisms. Align your sequence with the
genomic and mRNA CYP2D6 sequences to see where your PCR product’s sequence is
located within the CYP2D6 gene and whether any introns
lie in the sequence. The Multalin program you used
above (http://multalin.toulouse.inra.fr/multalin/) can do multiple sequence alignments. Remember to choose
the DNA alignment parameters, the end gap option and use the shorter
version of CYP2D6 genomic DNA (beginning at the ATG start codon
at http://chemlife.umd.edu/classroom/bsci415/straney/lab/CYP2D6_genomic_coding.html),
since the database version is be too large for a three-way comparison.
Copy and paste the genomic sequence
from your report into the white sequence box. Before the sequence, add a
line that says “>genomic” to identify the sequence in the search results.
After the genomic sequence, add an empty line to denote the end of the sequence, then insert the mRNA sequence with an identifying line before it, like “>mRNA”. Use only the portion of the mRNA sequence after the first ATG (do not paste in the highlighted 5’untranslated region). This will keep the numbering consistent with allele SNP positions in the literature.
After the genomic sequence, add an
empty line to denote the end of the sequence, then insert your corrected PCR
sequence with an identifier of “>correctedPCR”
Note that the poly(A) tail on the 3’ end of the mRNA sequence will not
align with the genomic sequence.
Paste
this alignment into your report. The default output is a .gif file. Select HTML
output at the bottom so you get a file you can modify in Word. Again, if color
fonts disappear, save the html file, reopen it in Word, and then save it as a
Word document. It is important to change the font to a “fixed” font, like Courier New and change the size of the font to retain the alignment’s
original formatting. Changing the maximum number of characters per line to 60 and the graduation
step to 60 (removes spaces) at the bottom also helps formatting.
How many exons are there in the
CYP2D6 gene?
Which exon(s) and/or intron(s) fall in your sequence?
Discuss how your sequence varies from the wild-type
sequence. Do the differences occur in exons or introns? Note that changes in the first 2 bases at the
beginning and end of an intron can eliminate splice
sites, creating different splicing.
- Now
find the location of the PCR and sequencing primers we used to amplify
this gene in the sequence alignment. Their sequences are:
(PCR) Ex6F2: 5’ AAGAAGTCGCTGGAGCAGTGGGTGA 3’
Ex11R: 5’ ACCGATGACAGGTTGGTGATGAGTGT 3’
4Flong: 5’ GCCTTTGTGCCGCCTTCGCCAACCACT 3’
2Rlong: 5’ CCCTCGGCCCCTGCACTGTTTCCCAGAT 3’
Sequencing
Forward: 5' ACTCTGTACCTCCTATCCACGTCA
Sequencing Reverse:
5' ACAGCATTCAGCACCTACACCAGA
Note that the Ex11R and 2Rlong
primers are in the reverse direction (3’ à
5’ when read from left to right), so you will need to find their reverse
complements (5’ à 3’ from left to
right), either by hand or by using a program like http://bioinformatics.org/sms/rev-comp.html
(and using the “reverse-complement” option).
To find the PCR primers in your
alignment, you can search for them by hand or use a search function in your
text program (e.g.: Find in Word). Note the spaces in the sequence may make
find difficult- you can remove all spaces with replace. The area between
the PCR primers is the region that was amplified in the PCR reaction,
and the sequence downstream (3’) of the sequencing primer is the portion of the
PCR product that was sequenced by the sequencing facility.
Highlight
or change the font color to make the primers stand out, and include an
identification key that details these changes in your final report.
How far downstream of the sequencing and PCR primers does
your sequence start?
Are they in introns or exons?
3.
Compare your corrected sequence(s) to the known polymorphisms in the CYP2D6
gene. The numbering of polymorphisms in databases should be
applicable to your sequence comparison as long as the genomic/mRNA sequence
starting at ATG was used.
One useful list is on http://www.imm.ki.se/CYPalleles/
. This database includes the enzyme activities of the alleles. See the
sequence alignment program below for a quick graphic comparison.
To make your life easier, the FASTA-style sequences of selected CYP2D6 alleles
(instead of a list of the polymorphisms) have been compiled at http://chemlife.umd.edu/classroom/bsci415/straney/lab/CYP2D6allelesDNA.html.
The polymorphisms in each allele appear in a different color from the rest of
the sequence.
Use the sequence alignment program at http://prodes.toulouse.inra.fr/multalin/multalin.html
to align your corrected sequence(s) (in FASTA format) with the various CYP2D6
alleles (just copy and paste the CYP2D6 allele sequences from the above link, then add your sequence(s)). Your PCR product is
shorter than the allele sequences which extend from primer 4Flong to 2Rlong. To
make a meaningful tree, pad your sequence with wild-type sequence out to the
4Flong and 2Rlong primers from your alignment.
Copy this alignment into your final report, along with a
discussion of the differences you see between your sequence and the various
CYP2D6 alleles. Does your sequence match any known CYP2D6 alleles?
If so, what is your
predicted drug metabolizing phenotype (ex: does your sequence match an allele
with a poor metabolizing phenotype)? A good reference for the range of
activities for different alleles is figure 1 in the paper: http://www.aapsj.org/articles/ps0204/ps020433/ps020433.pdf.
Also, look at activities of known alleles at http://www.imm.ki.se/CYPalleles/ if yours matches a known allele. Do you have two
different alleles, is there evidence for heterozygosity (do each of your predicted alleles match
known CYP2D6 alleles)?
If you can not find your specific polymorphisms in the CYP alleles database, check the human SNP database at http://www.ncbi.nlm.nih.gov/SNP/snp_ref.cgi?chooseRs=all&locusId=1565&mrna=NM_000106.4&ctg=NT_011520.12&prot=NP_000097.2&orien=forward&refresh=refresh
(you can
get here by searching under NCBI SNP for CYP2D6). Go to the first section
saying “Gene Model (mRNA..)”.Click on radio button for
in “gene region” and hit the “refresh” button. This will show SNPs in introns as well. The
numbering of polymorphisms is based upon the DNA contig.
The ATG starts at position 27977309 and goes down, since the gene is on the
bottom strand. Is your SNP in this database? It is organized by SNP alone and
does not include grouping of SNPs as alleles.
Click on the small tree graphic in
the white box that appears above the sequences you input. The tree will
appear in a new window; copy and paste this
tree into your report.
If all of the CYP2D6 alleles
do not appear in the sequence list (at left, only one appears), you may need to
click the link in the word “here” to have all of the
CYP2D6 alleles incorporated into the tree
Is
your sequence closely related to a known allele, or is it distinct enough to
create a new subclass?
- Obtain
the coding portion of your corrected sequence. To determine
which part of your sequence is coding sequence, you can either use your
alignment from part 2, when you aligned the genomic and mRNA sequences of
CYP2D6 with your unmodified sequence, or you can
run a new alignment using your corrected sequence(s) in place of your
unmodified sequence. Then look for areas in the alignment where all
three sequences align (with default settings, these are indicated by red
font)—these portions of the sequence are the coding portions.
“Splice” your corrected sequence by cutting and pasting together the exonic (coding) portions of your sequence, and
deleting the intronic (noncoding)
portions. Put your sequence into FASTA format.
- Using
this same splicing technique, obtain the coding portion of the
CYP2D6 gene that corresponds to (matches) your sequence.
- Translate
this coding portion of the wild-type CYP2D6 gene by using the ExPASy translation tool found at http://us.expasy.org/tools/dna.html.
Select the output format “Compact (“M”, “-”, no spaces).”
Your results will come back with six
different reading frames—choose the frame in the 5’à3’ direction that does not have any “-” symbols (these stand
for stop codons), since the coding portion of a gene
will not have stop codons (except for one at the 3’
end). If the correct reading frame is not clear, use the CYP2D6*1 protein
sequence from: http://www.ncbi.nlm.nih.gov/entrez/viewer.fcgi?db=protein&qty=1&c_start=1&list_uids=NP_000097.2&uids=&dopt=fasta&dispmax=5&sendto=&from=begin&to=end&extrafeatpresent=1&ef_CDD=8&ef_MGC=16&ef_HPRD=32&ef_STS=64&ef_tRNA=128&ef_microRNA=256&ef_Exon=512

- Using
the ExPASy translate tool, translate the coding
portion of your corrected sequence. Select the translation product
with the same reading frame that gave you no stop codons
with the coding portion of the CYP2D6 gene (with the above example, you
would select the “5’3’ Frame 2” reading frame for your
sequence).
- To
detect differences between your translation product and that of the
wild-type CYP2D6 gene, run an alignment of the two sequences with the
program at http://prodes.toulouse.inra.fr/multalin/multalin.html,
using the default “Blosum62 - 12 - 2” setting for the Symbol comparison
Table instead of “DNA - 5 - 0.”
Include
the translation products of both the gene sequence and your corrected
sequence(s) and discuss any differences you see between the two.
If you had any polymorphisms, did they affect the
translation product or were they silent mutations, were they in an exon or in an intron?
If you had amino acid substitutions, were they
conservative or nonconservative? How might the
substitution(s) affect the function of your gene?
If you have a single or double base pair insertion or
deletion, these will alter the reading frame of your protein, and the part of
your sequence downstream from this insertion/deletion will not align with the
wild-type protein sequence. Do you have evidence of this in your
sequence?
6. If you only have SNPs in introns, the sequence changes may have an effect upon
splicing. Read Dr. Mount's blog at http://ongenetics.blogspot.com/. Dr.
Mount is a professor in our department and teaches BSCI410. The
blog talks about the influence of seemingly innocuous SNPs upon splice site choice. A SNPs in introns that
alters splicing really messes with the protein. He has a program Spliceport (http://spliceport.cs.umd.edu/SplicingAnalyser2.html)
that predicts donor (5') and acceptor (3') splice sites. If you run the
prediction for the *1 allele and your allele (enter both as FASTA format),
and find a strong donor or acceptor site is added or lost in your allele, it
would offer a model to test (unfortunately with amplification of mRNA
from a wee little liver biopsy) or look into further.
![]()
Mollie
Minear, October 2005