Lab 13. Flow Cytometry - Cell Surface Antigens
Lymphocytes are the major players for the acquired immunity. To study and assay lymphocyte behavior, the cells must be isolated and the distinct lymphocyte subpopulations identified and separated. In Lab 4, you learnt how to isolate lymphocytes from the blood using density gradient centrifugation. But different lymphocyte subpopulations cannot be separated using the same method. All resting lymphocytes present a uniform appearance and density. The functional subpopulations of lymphocytes are usually identified and distinguished from each other on the basis of their differential expression of cell-surface proteins that can be detected using specific antibodies. B and T lymphocytes, for example, can be identified unambiguously by antibodies to the B- and T-cell antigen receptors. T cells are further subdivided on the basis of the expression of the co-receptors CD4 and CD8.
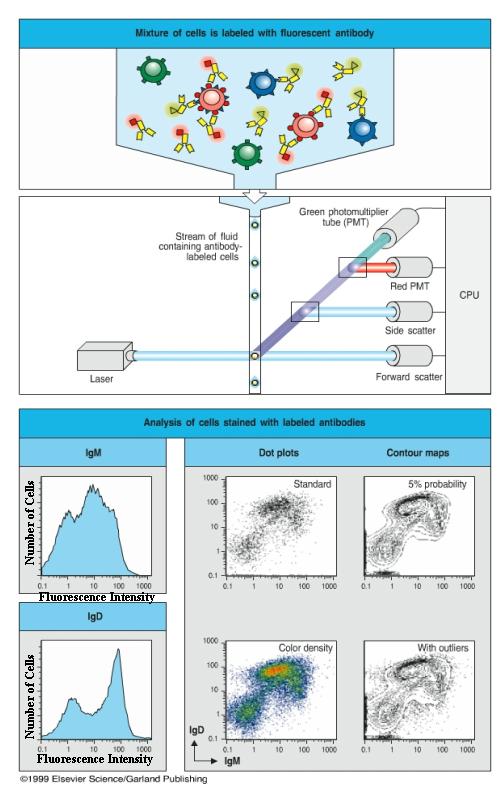
Flow cytometry is a powerful tool for defining lymphocytes through distinct molecules expressed on each population of the cells. Fluorochrome-conjugated antibodies are used to label a particular population of the cells in a mixture. The mixture of cells is then forced through a nozzle to create a fine stream of droplets, many of which will contain only a single cell. Each droplet passes in front a laser beam. When a cell passes through a laser beam, it will scatter the light. If the cell is labeled by fluorochrome-conjugated antibodies, it will fluoresce. Sensitive photomultiplier tubes detect both the scattered light, which gives information on the size of the cell, and the fluorescence emissions, which give information on the binding of labeled antibody and hence on the expression of cell-surface proteins by each cell.
When cells are labeled with a single fluorescent antibody, the data are usually displayed in the form of a histogram of fluorescence intensity versus cell numbers. If two or more fluorescent antibodies are used, each coupled to different fluorochromes, then the data are usually displayed in the form of a two-dimensional scatter diagram or a contour diagram, where the fluorescence of one fluorochrome-conjugated antibody is plotted against that of a second with the result that a population of cells labeled with one antibody can be further subdivided by its labeling with the second antibody. In a two-dimentional scatter diagram, each dot represents a cell. By examining large numbers of cells, the flow cytometer can give quantitative data on the percentage of cells bearing different molecules, such as membrane immunoglobulin (mIg), which characterizes B cells, or the T cell receptor-associated molecules known as CD3.
In this lab exercise, we will analyze different subpopulations of lymphocytes using flow cytometry. Resting B cells express mIgM, and resting T cells express CD3. A mixture of B and T cells will be incubated with fluorochrome-conjugated anti-IgM and anti-CD3e. The cells expressing different surface antigens will be quantitatively analyzed using flow cytometry.
Procedure
April 12
Solution:
FACS buffer: 5%
FCS, 0.02% NaN3 in PBS
1. You have three tubes each containing 2x10⁶ lymphocytes in 50 ml FASC buffer. These lymphocytes have been washed with FACS buffer 6 times.
2. To the cells, add:
| Tube | Addition | Function |
| 1 | - | No antibody control |
| 2 | 2 ml FITC-rat IgG2a | Isotype control |
| 3 | 4 ml
FITC-rat IgG2a-anti-mouse
CD3e
4 ml Cy3-rat IgG2a-anti-mouse IgM |
Positive sample |
3. Mix by flipping the tubes a few times. Incubate on ice, in the dark (cover with aluminum foil) for 30 min.
4. Resuspend the cells with 2 ml FACS buffer by gently pipetting up and down, and spin down the cells at 4oC. Remove and discard the supernatant with a p1000 pipetteman. Be very careful and do not disturb the cell pellets. Repeat two more times.
5. Fix the cells with 2% paraformaldehyde. Resuspend the cell pellets with 100 ml ice-cold 2% paraformaldehyde.
Your TA will store your cells at 4oC,
in the dark for 2 days.
April 14
Add 0.5 ml PBS to each of your samples.
Carry out flow cytometry analysis.
Analyze your data.
Reading
Immunobiology A22
Study Questions
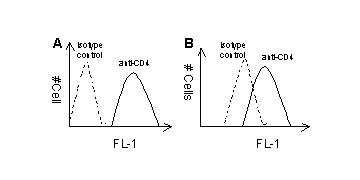
1. Flow cytometry has been widely used for determining surface antigens of cells. Two populations of cells (A & B) were stained with a FITC-conjugated antibody specific to CD4. Which of the populations expresses a higher level of this molecule and why?
2. Thymocytes from normal mice (A) and MHC class II knockout mice (B) were stained with antibodies specific to CD4 and CD8. The two color plots generated by flow cytometty are as follows. Please identify all subpopulations of T cells in the thymus.
3. List two controls that you have done in the flow cytometry exercise. What purpose does each control serve?
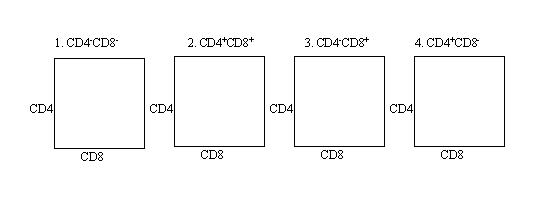
4. You have FITC-labeled anti-CD4 and PE-labeled anti-CD8. You use these antibodies to stain thymocytes. In the diagrams below, draw the FASC dot plots that you would expect for four different T cell populations.